[Kpt-Ahab] Simple AlgoPilot Riskmgt and Backtest Simple AlgoPilot Riskmgt and Backtest
This script provides a compact solution for automated risk management and backtesting within TradingView.
It offers the following core functionalities:
Risk Management:
The system integrates various risk limitation mechanisms:
Percentage-based or trailing stop-loss
Maximum losing streak limitation
Maximum drawdown limitation relative to account equity
Flexible position sizing control (based on equity, fixed size, or contracts)
Dynamic repurchasing of positions ("Repurchase") during losses with adjustable size scaling
Supports multi-stage take-profit targets (TP1/TP2) and automatic stop-loss adjustment to breakeven
External Signal Processing for Backtesting:
In addition to its own moving average crossovers, the script can process external trading signals:
External signals are received via a source input variable (e.g., from other indicators or signal generators)
Positive values (+1) trigger long positions, negative values (–1) trigger short positions
This allows for easy integration of other indicator-based strategies into backtests
Additional Backtesting Features:
Selection between different MA types (SMA, EMA, WMA, VWMA, HMA)
Flexible time filtering (trade only within defined start and end dates)
Simulation of commission costs, slippage, and leverage
Optional alert functions for moving average crossovers
Visualization of liquidation prices and portfolio development in an integrated table
Note: This script is primarily intended for strategic backtesting and risk setting optimization.
Real-time applications should be tested with caution. All order executions, alerts, and risk calculations are purely simulation-based.
Explanation of Calculations and Logics:
1. Risk Management and Position Sizing:
The position size is calculated based on the user’s choice using three possible methods:
Percentage of Equity:
The position size is a defined fraction of the available capital, dynamically adjusted based on market price (riskPerc / close).
Fixed Size (in currency): The user defines a fixed monetary amount to be used per trade.
Contracts: A fixed number of contracts is traded regardless of the current price.
Leverage: The selected leverage multiplies the position size for margin calculations.
2. Trade Logic and Signal Triggering:
Trades can be triggered through two mechanisms:
Internal Signals:
When a fast moving average crosses above or below a slower moving average (ta.crossover, ta.crossunder). The type of moving averages (SMA, EMA, WMA, VWMA, HMA) can be freely selected.
External Signals:
Signals from other indicators can be received via an input source field.
+1 triggers a long entry, –1 triggers a short entry.
Position Management:
Once entered, the position is actively managed.
Multiple take-profit targets are set.
Upon reaching a profit target, the stop-loss can optionally be moved to breakeven.
3. Stop-Loss and Take-Profit Logic:
Stop-Loss Types:
Fixed Percentage Stop:
A fixed distance below/above the entry price.
Trailing Stop:
Dynamically adjusts as the trade moves into profit.
Fast Trailing Stop:
A more aggressive variant of trailing that reacts quicker to price changes.
Take-Profit Management:
Two take-profit targets (TP1 and TP2) are supported, allowing partial exits at different stages.
Remaining positions can either reach the second target or be closed by the stop-loss.
4. Repurchase Strategy ("Scaling In" on Losses):
If a position reaches a specified loss threshold (e.g., –15%), an automatic additional purchase can occur.
The position size is increased by a configurable percentage.
Repurchases happen only if an initial position is already open.
5. Backtesting Control and Filters:
Time Filters:
A trading period can be defined (start and end date).
All trades outside the selected period are ignored.
Risk Filters: Trading is paused if:
A maximum losing streak is reached.
A maximum allowed drawdown is exceeded.
6. Liquidation Calculation (Simulation Only):
The script simulates liquidation prices based on the account balance and position size.
Liquidation lines are drawn on the chart to better visualize potential risk exposure.
This is purely a visual aid — no real broker-side liquidation is performed.
Cerca negli script per "stop loss"
Dskyz Adaptive Futures Edge (DAFE)imgur.com/a/igj9lFj
Dskyz Adaptive Futures Edge (DAFE) is a futures trading strategy designed to adapt dynamically to market volatility and price action using a blend of technical indicators. The strategy combines adaptive moving averages, optional RSI filtering, candlestick pattern recognition, and multi-timeframe trend analysis to generate long and short trade signals. It incorporates robust risk management techniques including ATR-based stop-losses and trailing stops, ensuring trades are sized and managed within sustainable risk limits.
Key Components and Logic
-Adaptive Moving Averages
Dynamic Calculation: Fast and slow Simple Moving Averages (SMAs) adapt to changing volatility, making them sensitive to high-momentum shifts and smoothing during quieter price action.
Signal Generation: Entry signals are triggered when the fast SMA crosses the slow SMA in conjunction with price direction confirmation (e.g., price above both for long positions).
-RSI Filtering (Optional)
Momentum Confirmation: The RSI filter provides momentum confirmation to avoid overextended entries. It can be toggled on or off for both long and short conditions.
User Control: Adjustable parameters such as lookback period, oversold/overbought thresholds, and enable/disable switches give full control over its influence.
-Candlestick Pattern Recognition
Engulfing Logic: Recognizes strong bullish or bearish engulfing patterns with configurable strength criteria like range and volume. Patterns are filtered by trend direction and strength for confirmation.
Signal Conflict Handling: When both bullish and bearish engulfing patterns occur within the lookback window, the strategy avoids entry to reduce whipsaws in indecisive markets.
-Multi-Timeframe Trend Filter
Higher Timeframe Filtering: Incorporates 15-minute trend direction as a macro-level filter to align intrabar trades with larger trend momentum.
Smoothed Entry Logic: Prevents entering trades that go against the broader market structure, reducing false signals in choppy or low-conviction moves.
-Trade Execution and Risk Management
imgur.com
Entry Logic
Priority System: Users can define whether moving average signals or candlestick patterns should take priority when both are present.
Volume & Volatility Checks: Ensures sufficient market participation and action before entering a position, improving the odds of reliable follow-through.
Stop-Loss and Trailing Exit
ATR-Based Initial Stops: Dynamically adjusts stop-loss distance based on market volatility using a multiple of ATR (Average True Range), keeping risk proportional to price swings.
Trailing Stop: Protects open profits and enables winners to run by following price action at a set distance (also ATR-based).
-Cooldown Period & Minimum Bar Hold (Trade Discipline Logic)
Cooldown Bars: After an exit, the strategy imposes a mandatory pause before opening a new position.
Why: This avoids rapid-fire re-entries triggered by minor fluctuations that could lead to overtrading and degradation of profitability.
Minimum Bar Hold: A trade must be held for a minimum number of bars before it can be exited.
Why: This prevents the strategy from immediately exiting trades due to fleeting volatility spikes, which previously caused premature exits that often reversed back in favor of the original signal. This ensures trades have adequate time to develop, filtering out noise from true reversals.
-Visual Elements and Transparency Tools
Chart Overlays: Moving averages, RSI values, and trade entry/exit points are shown directly on the chart for complete visibility.
Dashboard UI: Displays critical live metrics—current position, PnL, time held, ATR values, etc.
Debug Logs: Optional toggles allow verbose condition tracking for deep inspection into why a trade occurred (or didn't), useful for both live optimization and debugging.
-Input Parameter Reference Guide
Input Name Function & Suggested Use
Use RSI Filter - Enables or disables RSI-based entry confirmation. Disable if price action alone is desired for entry decisions.
RSI Length - RSI lookback period. Lower values (e.g., 7–14) are more responsive; higher values reduce false signals.
Overbought / Oversold Levels - Used to detect exhaustion zones. E.g., avoid long entries above 70 or short entries below 30.
Use Candlestick Patterns - Enable detection of bullish/bearish engulfing patterns as trade signals. Disable to rely only on trend/MA.
Pattern Strength Thresholds (Range, Volume) - Filters out weak engulfing signals. Higher values require stronger patterns to trigger.
Use 15min Trend Filter - Adds multi-timeframe trend confirmation. Recommended for filtering entries against larger trend direction.
Fast MA - Base Length for fast adaptive moving average. Suggested: 10–25.
Slow MA - Base length for slow adaptive moving average. Suggested: 30–60.
Volatility Sensitivity Multiplier - Multiplies volatility adjustments for adaptive MA length. Higher = more reactive to volatility.
Entry Volume Filter - Filters out trades during low volume. Recommended to prevent entries in illiquid conditions.
ATR Length - Lookback period for ATR calculation. Suggested: 14.
Trailing Stop ATR Offset - Defines how far the stop-loss is from entry. 1.5–2.5 is typical for medium-volatility environments.
Trailing Stop ATR Multiplier - Determines trailing stop distance. 1.5 is tight; 3+ gives more room for trending trades.
Cooldown Bars After Exit - Prevents immediate re-entries. Suggested: 3–10 bars depending on timeframe.
Minimum Bars to Hold Trade - Ensures trades are held long enough to avoid knee-jerk exits. Suggested: 5–10 for intraday strategies.
Trading Hours (Start / End) - Sets the window of allowed trading. Prevents entries outside key session times (e.g., avoid pre-market).
Enable Logging / Debugging - Shows internal trade decision data for tuning and understanding the logic.
Compliance with TradingView Regulations
Realistic Backtesting: The strategy uses proper initial capital, fixed trade quantities, and risk parameters to reflect realistic scenarios.
Transparent Trade Logic: Every condition used for signal generation is documented and controllable by the user. Users can view each signal's rationale.
Risk Mitigation: Cooldown bars, ATR stops, and minimum trade duration ensure the strategy behaves predictably and prevents reckless trade behavior.
Customization: Full control over each module (MA, RSI, Candlestick, Trend, etc.) gives users the ability to tailor the strategy to suit various futures contracts or timeframes.
imgur.com
imgur.com
imgur.com
imgur.com
imgur.com
Summary
DAFE was built for high-stakes micro futures trading environments such as the MNQ, where milliseconds of volatility matter. This strategy's modular architecture, adaptive logic, and advanced risk controls make it an ideal framework for scalpers and swing traders alike.
BTCUSDT.P
Backtesting: www.dropbox.com
Deep Backtesting:
www.dropbox.com
****Currently testing on a prop account.
Caution Statement
This strategy is designed for educational and experimental purposes and should not be considered financial advice or a guaranteed method of profitability. While the DAFE (Dskyz Adaptive Futures Edge) strategy incorporates advanced filters, adaptive logic, and volatility-based risk management, its performance is subject to market conditions, data accuracy, and user configuration.
Futures trading involves substantial risk, and the leverage inherent in futures contracts can amplify both gains and losses. This strategy may execute trades rapidly and frequently under certain conditions—particularly when filters are disabled or thresholds are set too tightly—potentially leading to increased slippage, commissions, or unanticipated losses.
Users are strongly advised to:
Backtest thoroughly across various market regimes.
Adjust parameters responsibly and understand the implication of each input.
Paper trade in a simulated environment before going live.
Monitor trades actively and use discretion when market volatility increases.
-By using this strategy, you accept all risks and responsibility for any trading decisions made based on its output.

Smart MA Crossover BacktesterSmart MA Crossover Backtester - Strategy Overview
Strategy Name: Smart MA Crossover Backtester
Published on: TradingView
Applicable Markets: Works well on crypto (tested profitably on ETH)
Strategy Concept
The Smart MA Crossover Backtester is an improved Moving Average (MA) crossover strategy that incorporates a trend filter and an ATR-based stop loss & take profit mechanism for better risk management. It aims to capture trends efficiently while reducing false signals by only trading in the direction of the long-term trend.
Core Components & Logic
Moving Averages (MA) for Entry Signals
Fast Moving Average (9-period SMA)
Slow Moving Average (21-period SMA)
A trade signal is generated when the fast MA crosses the slow MA.
Trend Filter (200-period SMA)
Only enters long positions if price is above the 200-period SMA (bullish trend).
Only enters short positions if price is below the 200-period SMA (bearish trend).
This helps in avoiding counter-trend trades, reducing whipsaws.
ATR-Based Stop Loss & Take Profit
Uses the Average True Range (ATR) with a multiplier of 2 to calculate stop loss.
Risk-Reward Ratio = 1:2 (Take profit is set at 2x ATR).
This ensures dynamic stop loss and take profit levels based on market volatility.
Trading Rules
✅ Long Entry (Buy Signal):
Fast MA (9) crosses above Slow MA (21)
Price is above the 200 MA (bullish trend filter active)
Stop Loss: Below entry price by 2× ATR
Take Profit: Above entry price by 4× ATR
✅ Short Entry (Sell Signal):
Fast MA (9) crosses below Slow MA (21)
Price is below the 200 MA (bearish trend filter active)
Stop Loss: Above entry price by 2× ATR
Take Profit: Below entry price by 4× ATR
Why This Strategy Works Well for Crypto (ETH)?
🔹 Crypto markets are highly volatile – ATR-based stop loss adapts dynamically to market conditions.
🔹 Long-term trend filter (200 MA) ensures trading in the dominant direction, reducing false signals.
🔹 Risk-reward ratio of 1:2 allows for profitable trades even with a lower win rate.
This strategy has been tested on Ethereum (ETH) and has shown profitable performance, making it a strong choice for crypto traders looking for trend-following setups with solid risk management. 🚀

Breaks and Retests - Free990Strategy Description: "Breaks and Retests - Free990"
The "Breaks and Retests - Free990" strategy is based on identifying breakout and retest opportunities for potential entries in both long and short trades. The idea is to detect price breakouts above resistance levels or below support levels, and subsequently identify retests that confirm the breakout levels. The strategy offers an automated approach to enter trades after a breakout followed by a retest, which serves as a confirmation of trend continuation.
Key Components:
Support and Resistance Detection:
The strategy calculates pivot levels based on historical price movements to define support and resistance areas. A lookback range is used to determine these key levels.
Breakouts and Retests:
The system identifies when a breakout occurs above a resistance level or below a support level.
It then waits for a retest of the previously broken level as confirmation, which is often a better entry opportunity.
Trade Direction Selection:
Users can choose between "Long Only," "Short Only," or "Both" directions for trading based on their market view.
Stop Loss and Trailing Stop:
An initial stop loss is placed at a defined percentage away from the entry.
The trailing stop loss is activated after the position gains a specified percentage in profit.
Long Entry:
A long entry is triggered if the price breaks above a resistance level and subsequently retests that level successfully.
The entry condition checks if the breakout was confirmed and if a retest was valid.
The long entry is only executed if the user-selected direction is either "Long Only" or "Both."
Short Entry:
A short entry is triggered if the price breaks below a support level and subsequently retests that level.
The short entry is only executed if the user-selected direction is either "Short Only" or "Both."
sell_condition checks whether the support has been broken and whether the retest condition is valid.
An initial stop loss is placed when the trade is opened to limit the risk if the trade moves against the position.
The stop loss is calculated based on a user-defined percentage (stop_loss_percent) of the entry price.
pinescript
Copy code
stop_loss_price := strategy.position_avg_price * (1 - stop_loss_percent / 100)
For long positions, the stop loss is placed below the entry price.
For short positions, the stop loss is placed above the entry price.
Trailing Stop:
When a position achieves a certain profit threshold (profit_threshold_percent), the trailing stop mechanism is activated.
For long positions, the trailing stop follows the highest price reached, ensuring that some profit is locked in if the price reverses.
For short positions, the trailing stop follows the lowest price reached.
Code Logic for Trailing Stop:
Exit Execution:
The strategy exits the position when the price hits the calculated stop loss level.
This includes both the initial stop loss and the trailing stop that adjusts as the trade progresses.
Code Logic for Exit:
Summary:
Breaks and Retests - Free990 uses support and resistance levels to identify breakouts, followed by retests for confirmation.
Entry Points: Triggered when a breakout is confirmed and a retest occurs, for both long and short trades.
Exit Points:
Initial Stop Loss: Limits risk for both long and short trades.
Trailing Stop Loss: Locks in profits as the price moves in favor of the position.
This strategy aims to capture the momentum after breakouts and minimize losses through effective use of stop loss and trailing stops. It gives the flexibility of selecting trade direction and ensures trades are taken with confirmation through the retest, which helps to reduce false breakouts.
Original Code by @HoanGhetti

Dual Strategy Selector V2 - CryptogyaniOverview:
This script provides traders with a dual-strategy system that they can toggle between using a simple dropdown menu in the input settings. It is designed to cater to different trading styles and needs, offering both simplicity and advanced filtering techniques. The strategies are built around moving average crossovers, enhanced by configurable risk management tools like take profit levels, trailing stops, and ATR-based stop-loss.
Key Features:
Two Strategies in One Script:
Strategy 1: A classic moving average crossover strategy for identifying entry signals based on trend reversals. Includes user-defined take profit and trailing stop-loss options for profit locking.
Strategy 2: An advanced trend-following system that incorporates:
A higher timeframe trend filter to confirm entry signals.
ATR-based stop-loss for dynamic risk management.
Configurable partial take profit to secure gains while letting the trade run.
Highly Customizable:
All key parameters such as SMA lengths, take profit levels, ATR multiplier, and timeframe for the trend filter are adjustable via the input settings.
Dynamic Toggle:
Traders can switch between Strategy 1 and Strategy 2 with a single dropdown, allowing them to adapt the strategy to market conditions.
How It Works:
Strategy 1:
Entry Logic: A long trade is triggered when the fast SMA crosses above the slow SMA.
Exit Logic: The trade exits at either a user-defined take profit level (percentage or pips) or via an optional trailing stop that dynamically adjusts based on price movement.
Strategy 2:
Entry Logic: Builds on the SMA crossover logic but adds a higher timeframe trend filter to align trades with the broader market direction.
Risk Management:
ATR-Based Stop-Loss: Protects against adverse moves with a volatility-adjusted stop-loss.
Partial Take Profit: Allows traders to secure a percentage of gains while keeping some exposure for extended trends.
How to Use:
Select Your Strategy:
Use the dropdown in the input settings to choose Strategy 1 or Strategy 2.
Configure Parameters:
Adjust SMA lengths, take profit, and risk management settings to align with your trading style.
For Strategy 2, specify the higher timeframe for trend filtering.
Deploy and Monitor:
Apply the script to your preferred asset and timeframe.
Use the backtest results to fine-tune settings for optimal performance.
Why Choose This Script?:
This script stands out due to its dual-strategy flexibility and enhanced features:
For beginners: Strategy 1 provides a simple yet effective trend-following system with minimal setup.
For advanced traders: Strategy 2 includes powerful tools like trend filters and ATR-based stop-loss, making it ideal for challenging market conditions.
By combining simplicity with advanced features, this script offers something for everyone while maintaining full transparency and user customization.
Default Settings:
Strategy 1:
Fast SMA: 21, Slow SMA: 49
Take Profit: 7% or 50 pips
Trailing Stop: Optional (disabled by default)
Strategy 2:
Fast SMA: 20, Slow SMA: 50
ATR Multiplier: 1.5
Partial Take Profit: 50%
Higher Timeframe: 1 Day (1D)

Crypto Volatility Bitcoin Correlation Strategy Description:
The Crypto Volatility Bitcoin Correlation Strategy is designed to leverage market volatility specifically in Bitcoin (BTC) using a combination of volatility indicators and trend-following techniques. This strategy utilizes the VIXFix (a volatility indicator adapted for crypto markets) and the BVOL7D (Bitcoin 7-Day Volatility Index from BitMEX) to identify periods of high volatility, while confirming trends with the Exponential Moving Average (EMA). These components work together to offer a comprehensive system that traders can use to enter positions when volatility and trends are aligned in their favor.
Key Features:
VIXFix (Volatility Index for Crypto Markets): This indicator measures the highest price of Bitcoin over a set period and compares it with the current low price to gauge market volatility. A rise in VIXFix indicates increasing market volatility, signaling that large price movements could occur.
BVOL7D (Bitcoin 7-Day Volatility Index): This volatility index, provided by BitMEX, measures the volatility of Bitcoin over the past 7 days. It helps traders monitor the recent volatility trend in the market, particularly useful when making short-term trading decisions.
Exponential Moving Average (EMA): The 50-period EMA acts as a trend indicator. When the price is above the EMA, it suggests the market is in an uptrend, and when the price is below the EMA, it suggests a downtrend.
How It Works:
Long Entry: A long position is triggered when both the VIXFix and BVOL7D indicators are rising, signaling increased volatility, and the price is above the 50-period EMA, confirming that the market is trending upward.
Exit: The strategy exits the position when the price crosses below the 50-period EMA, which signals a potential weakening of the uptrend and a decrease in volatility.
This strategy ensures that traders only enter positions when the volatility aligns with a clear trend, minimizing the risk of entering trades during periods of market uncertainty.
Testing and Timeframe:
This strategy has been tested on Bitcoin using the daily timeframe, which provides a longer-term perspective on market trends and volatility. However, users can adjust the timeframe according to their trading preferences. It is crucial to note that this strategy does not include comprehensive risk management, aside from the exit condition when the price crosses below the EMA. Users are strongly advised to implement their own risk management techniques, such as setting appropriate stop-loss levels, to safeguard their positions during high volatility periods.
Utility:
The Crypto Volatility Bitcoin Correlation Strategy is particularly well-suited for traders who aim to capitalize on the high volatility often seen in the Bitcoin market. By combining volatility measurements (VIXFix and BVOL7D) with a trend-following mechanism (EMA), this strategy helps identify optimal moments for entering and exiting trades. This approach ensures that traders participate in potentially profitable market moves while minimizing exposure during times of uncertainty.
Use Cases:
Volatility-Based Entries: Traders looking to take advantage of market volatility spikes will find this strategy useful for timing entry points during market swings.
Trend Confirmation: By using the EMA as a confirmation tool, traders can avoid entering trades that go against the trend, which can result in significant losses during volatile market conditions.
Risk Management: While the strategy exits when price falls below the EMA, it is important to recognize that this is not a full risk management system. Traders should use caution and integrate additional risk measures, such as stop-losses and position sizing, to better manage potential losses.
How to Use:
Step 1: Monitor the VIXFix and BVOL7D indicators. When both are rising and the Bitcoin price is above the EMA, the strategy will trigger a long entry, indicating that the market is experiencing increased volatility with a confirmed uptrend.
Step 2: Exit the position when the price drops below the 50-period EMA, signaling that the trend may be reversing or weakening, reducing the likelihood of continued upward price movement.
This strategy is open-source and is intended to help traders navigate volatile market conditions, particularly in Bitcoin, using proven indicators for volatility and trend confirmation.
Risk Disclaimer:
This strategy has been tested on the daily timeframe of Bitcoin, but users should be aware that it does not include built-in risk management except for the below-EMA exit condition. Users should be extremely cautious when using this strategy and are encouraged to implement their own risk management, such as using stop-losses, position sizing, and setting appropriate limits. Trading involves significant risk, and this strategy does not guarantee profits or prevent losses. Past performance is not indicative of future results. Always test any strategy in a demo environment before applying it to live markets.

Fractal Breakout Trend Following StrategyOverview
The Fractal Breakout Trend Following Strategy is a trend-following system which utilizes the Willams Fractals and Alligator to execute the long trades on the fractal's breakouts which have a high probability to be the new uptrend phase beginning. This system also uses the normalized Average True Range indicator to filter trades after a large moves, because it's more likely to see the trend continuation after a consolidation period. Strategy can execute only long trades.
Unique Features
Trend and volatility filtering system: Strategy uses Williams Alligator to filter the counter-trend fractals breakouts and normalized Average True Range to avoid the trades after large moves, when volatility is high
Configurable Trading Periods: Users can tailor the strategy to specific market windows, adapting to different market conditions.
Flexible Risk Management: Users can choose the stop-loss percent (by default = 3%) for trades, but strategy also has the dynamic stop-loss level using down fractals.
Methodology
The strategy places stop order at the last valid fractal breakout level. Validity of this fractal is defined by the Williams Alligator indicator. If at the moment of time when price breaking the last fractal price is higher than Alligator's teeth line (8 period SMA shifted 5 bars in the future) this is a valid breakout. Moreover strategy has the additional volatility filtering system using normalized ATR. It calculates the average normalized ATR for last user-defined number of bars and if this value lower than the user-defined threshold value the long trade is executed.
When trade is opened, script places the stop loss at the price higher of two levels: user defined stop-loss from the position entry price or down fractal validation level. The down fractal is valid with the rule, opposite as the up fractal validation. Price shall break to the downside the last down fractal below the Willians Alligator's teeth line.
Strategy has no fixed take profit. Exit level changes with the down fractal validation level. If price is in strong uptrend trade is going to be active until last down fractal is not valid. Strategy closes trade when price hits the down fractal validation level.
Risk Management
The strategy employs a combined approach to risk management:
It allows positions to ride the trend as long as the price continues to move favorably, aiming to capture significant price movements. It features a user-defined stop-loss parameter to mitigate risks based on individual risk tolerance. By default, this stop-loss is set to a 3% drop from the entry point, but it can be adjusted according to the trader's preferences.
Justification of Methodology
This strategy leverages Williams Fractals to open long trade when price has broken the key resistance level to the upside. This resistance level is the last up fractal and is shall be broken above the Williams Alligator's teeth line to be qualified as the valid breakout according to this strategy. The Alligator filtering increases the probability to avoid the false breakouts against the current trend.
Moreover strategy has an additional filter using Average True Range(ATR) indicator. If average value of ATR for the last user-defined number of bars is lower than user-defined threshold strategy can open the long trade according to open trade condition above. The logic here is following: we want to open trades after period of price consolidation inside the range because before and after a big move price is more likely to be in sideways, but we need a trend move to have a profit.
Another one important feature is how the exit condition is defined. On the one hand, strategy has the user-defined stop-loss (3% below the entry price by default). It's made to give users the opportunity to restrict their losses according to their risk-tolerance. On the other hand, strategy utilizes the dynamic exit level which is defined by down fractal activation. If we assume the breaking up fractal is the beginning of the uptrend, breaking down fractal can be the start of downtrend phase. We don't want to be in long trade if there is a high probability of reversal to the downside. This approach helps to not keep open trade if trend is not developing and hold it if price continues going up.
Backtest Results
Operating window: Date range of backtests is 2023.01.01 - 2024.05.01. It is chosen to let the strategy to close all opened positions.
Commission and Slippage: Includes a standard Binance commission of 0.1% and accounts for possible slippage over 5 ticks.
Initial capital: 10000 USDT
Percent of capital used in every trade: 30%
Maximum Single Position Loss: -3.19%
Maximum Single Profit: +24.97%
Net Profit: +3036.90 USDT (+30.37%)
Total Trades: 83 (28.92% win rate)
Profit Factor: 1.953
Maximum Accumulated Loss: 963.98 USDT (-8.29%)
Average Profit per Trade: 36.59 USDT (+1.12%)
Average Trade Duration: 72 hours
These results are obtained with realistic parameters representing trading conditions observed at major exchanges such as Binance and with realistic trading portfolio usage parameters.
How to Use
Add the script to favorites for easy access.
Apply to the desired timeframe and chart (optimal performance observed on 4h and higher time frames and the BTC/USDT).
Configure settings using the dropdown choice list in the built-in menu.
Set up alerts to automate strategy positions through web hook with the text: {{strategy.order.alert_message}}
Disclaimer:
Educational and informational tool reflecting Skyrex commitment to informed trading. Past performance does not guarantee future results. Test strategies in a simulated environment before live implementation

IsAlgo - Support & Resistance Strategy► Overview:
The Support & Resistance Strategy is designed to identify critical support and resistance levels and execute trades when the price crosses these levels. Utilizing a combination of a moving average, ATR indicator, and the highest and lowest prices, this strategy aims to accurately pinpoint entry and exit points for trades based on market movements.
► Description:
The Support & Resistance Strategy leverages the ATR (Average True Range) and a moving average to identify key support and resistance levels. The strategy calculates these levels by measuring the distance between the current market price and the moving average. This distance is continuously compared with each new candle to provide an estimate of the support and resistance levels.
The ATR is utilized to determine the width of these levels, ensuring they adjust to market volatility. To validate these levels, the strategy counts how often a candle’s low or high touches the estimated support or resistance and then bounces back. A higher frequency of such touches indicates a stronger, more reliable level.
Once the levels are confirmed, the strategy waits for a candle to close above the resistance level or below the support level. A candle closing above the resistance triggers a long entry, while a candle closing below the support triggers a short entry.
The strategy incorporates multiple stop-loss options to manage risk effectively. These options include setting stop-loss levels based on fixed pips, ATR calculations, or the highest/lowest prices of previous candles. Up to three take-profit levels can be set using fixed pips, ATR, or risk-to-reward ratios. A trailing stop feature adjusts the stop loss as the trade moves into profit, and a break-even feature moves the stop loss to the entry price once a certain profit level is reached.
Additionally, the strategy can close trades if the price crosses the opposite support or resistance level or if a candle moves significantly against the trade direction.
↑ Long Entry Example:
↓ Short Entry Example:
► Features & Settings:
⚙︎ Levels: Configure the length, width, and ATR period for support and resistance levels.
⚙︎ Moving Average: Use an Exponential Moving Average (EMA) to confirm trend direction. This can be enabled or disabled.
⚙︎ Entry Candle: Define the minimum and maximum body size and the body-to-candle size ratio for entry candles.
⚙︎ Trading Session: Specify the trading hours during which the strategy operates.
⚙︎ Trading Days: Select which days of the week the strategy is active.
⚙︎ Backtesting: Set a backtesting period with start and end dates. This feature can be deactivated.
⚙︎ Trades: Customize trade direction (long, short, or both), position sizing (fixed or percentage-based), maximum open trades, and daily trade limits.
⚙︎ Trades Exit: Choose from various exit methods, including profit/loss limits, trade duration, or crossing the opposite support/resistance level.
⚙︎ Stop Loss: Set stop-loss levels using fixed pips, ATR-based calculations, or the highest/lowest price within a specified number of previous candles.
⚙︎ Break Even: Adjust the stop loss to break-even once certain profit conditions are met.
⚙︎ Trailing Stop: Automatically adjust the stop loss as the trade moves into profit.
⚙︎ Take Profit: Define up to three take-profit levels using fixed pips, ATR, or risk-to-reward ratios based on the stop loss.
⚙︎ Alerts: Receive alerts for significant actions such as trade openings and closings, with support for dynamic values.
⚙︎ Dashboard: A visual display on the chart providing detailed information about ongoing and past trades.
► Backtesting Details:
Timeframe: 1-hour US30 chart
Initial Balance: $10,000
Order Size: 5 Units
Commission: $0.5 per contract
Slippage: 5 ticks
Stop Loss: Based on the opposite support/resistance level or break-even adjustments

Momentum Alligator 4h Bitcoin StrategyOverview
The Momentum Alligator 4h Bitcoin Strategy is a trend-following trading system that operates on dual time frames. It utilizes the 1D Williams Alligator indicator to identify the prevailing major price trend and seeks trading opportunities on the 4-hour (4h) time frame when the momentum is turning up. The strategy is designed to close trades if the trend fails to develop or holding position if price continues increasing without any significant correction. Note that this strategy is specifically tailored for the 4-hour time frame.
Unique Features
2-layers market noise filtering system: Trades are only initiated in the direction of the 1D trend, determined by the Williams Alligator indicator. This higher time frame confirmation filters out minor trade signals, focusing on more substantial opportunities. At the same time, strategy has additional filter on 4h time frame with Awesome Oscillator which is showing the current price momentum.
Flexible Risk Management: The strategy exclusively opens long positions, resulting in fewer trades during bear markets. It incorporates a dynamic stop-loss mechanism, which can either follow the jaw line of the 4h Alligator or a user-defined fixed stop-loss. This flexibility helps manage risk and avoid non-trending markets.
Methodology
The strategy initiates a long position when the d-line of Stochastic RSI crosses up it's k-line. It means that there is a high probability that price momentum reversed from down to up. To avoid overtrading in potentially choppy markets, it skips the next two trades following a winning trade, anticipating sideways movement after a significant price surge.
This strategy has two layers trades filtering system: 4h and 1D time frames. The first one is awesome oscillator. It shall be increasing and value has to be higher than it's 5-period SMA. This is an additional confirmation that long trade is opened in the direction of the current momentum. As it was mentioned above, all entry signals are validated against the 1D Williams Alligator indicator. A trade is only opened if the price is above all three lines of the 1D Alligator, ensuring alignment with the major trend.
A trade is closed if the price hits the 4h jaw line of the Alligator or reaches the user-defined stop-loss level.
Risk Management
The strategy employs a combined approach to risk management:
It allows positions to ride the trend as long as the price continues to move favorably, aiming to capture significant price movements. It features a user-defined stop-loss parameter to mitigate risks based on individual risk tolerance. By default, this stop-loss is set to a 2% drop from the entry point, but it can be adjusted according to the trader's preferences.
Justification of Methodology
This strategy leverages Stochastic RSI on 4h time frame to open long trade when momentum started reversing to the upside. On the one hand, Stochastic RSI is one of the most sensitive indicator, which allows to react fast on the potential trend reversal. On the other hand, this indicator can be too sensitive and provide a lot of false trend changing signals. To eliminate this weakness we use two-layers trades filtering system.
The first layer is the 4h Awesome oscillator. This is less sensitive momentum indicator. Usually it starts increasing when price has already passed significant distance from the actual reversal point. The strategy opens long trade only is Awesome oscillator is increasing and above it's 5-period SMA. This approach increases the probability to filter the false signals during the choppy market or if the reversal is false.
The second layer filter is the Williams Alligator indicator on 1D time frame. The 1D Alligator serves as a filter for identifying the primary trend and increases probability to avoid the trades with low potential because trading against major trend usually is more risky. It's much better to catch the trend continuation than local bounce.
Last but not least feature of this strategy is close trades condition. It uses the flexible approach. First of all, user can set up the fixed stop-loss according to his own risk-tolerance, by default this value is 2% of price movement. It restricts the potential loss at the moment when trade has just been opened. Moreover strategy utilizes the 4h Williams Alligator's jaw line to exit the trade. If price fell below it trade is closed. This approach helps to not keep open trade if trend is not developing and hold it if price continues going up.
Backtest Results:
Operating window: Date range of backtests is 2021.01.01 - 2024.05.01. It is chosen to let the strategy to close all opened positions.
Commission and Slippage: Includes a standard Binance commission of 0.1% and accounts for possible slippage over 5 ticks.
Initial capital: 10000 USDT
Percent of capital used in every trade: 50%
Maximum Single Position Loss: -3.04%
Maximum Single Profit: +29.67%
Net Profit: +6228.01 USDT (+62.28%)
Total Trades: 118 (24.58% win rate)
Profit Factor: 1.71
Maximum Accumulated Loss: 1527.69 USDT (-11.52%)
Average Profit per Trade: 52.78 USDT (+0.89%)
Average Trade Duration: 60 hours
These results are obtained with realistic parameters representing trading conditions observed at major exchanges such as Binance and with realistic trading portfolio usage parameters.
How to Use:
Add the script to favorites for easy access.
Apply to the 4h timeframe desired chart (optimal performance observed on the BTC/USDT).
Configure settings using the dropdown choice list in the built-in menu.
Set up alerts to automate strategy positions through web hook with the text: {{strategy.order.alert_message}}
Disclaimer:
Educational and informational tool reflecting Skyrex commitment to informed trading. Past performance does not guarantee future results. Test strategies in a simulated environment before live implementation

MACD of Relative Strenght StrategyMACD Relative Strenght Strategy :
INTRODUCTION :
This strategy is based on two well-known indicators: MACD and Relative Strenght (RS). By coupling them, we obtain powerful buy signals. In fact, the special feature of this strategy is that it creates an indicator from an indicator. Thus, we construct a MACD whose source is the value of the RS. The strategy only takes buy signals, ignoring SHORT signals as they are mostly losers. There's also a money management method enabling us to reinvest part of the profits or reduce the size of orders in the event of substantial losses.
RELATIVE STRENGHT :
RS is an indicator that measures the anomaly between momentum and the assumption of market efficiency. It is used by professionals and is one of the most robust indicators. The idea is to own assets that do better than average, based on their past performance. We calculate RS using this formula :
RS = close/highest_high(RS_Length)
Where highest_high(RS_Length) = highest value of the high over a user-defined time period (which is the RS_Length).
We can thus situate the current price in relation to its highest price over this user-defined period.
MACD (Moving Average Convergence - Divergence) :
This is one of the best-known indicators, measuring the distance between two exponential moving averages : one fast and one slower. A wide distance indicates fast momentum and vice versa. We'll plot the value of this distance and call this line macdline. The MACD uses a third moving average with a lower period than the first two. This last moving average will give a signal when it crosses the macdline. It is therefore constructed using the values of the macdline as its source.
It's important to note that the first two MAs are constructed using RS values as their source. So we've just built an indicator of an indicator. This kind of method is very powerful because it is rarely used and brings value to the strategy.
PARAMETERS :
RS Length : Relative Strength length i.e. the number of candles back to find the highest high and compare the current price with this high. Default is 300.
MACD Fast Length : Relative Strength fast EMA length used to plot the MACD. Default is 14.
MACD Slow Length : Relative Strength slow EMA length used to plot the MACD. Default is 26.
MACD Signal Smoothing : Macdline SMA length used to plot the MACD. Default is 10.
Max risk per trade (in %) : The maximum loss a trade can incur (in percentage of the trade value). Default is 8%.
Fixed Ratio : This is the amount of gain or loss at which the order quantity is changed. Default is 400, meaning that for each $400 gain or loss, the order size is increased or decreased by a user-selected amount.
Increasing Order Amount : This is the amount to be added to or subtracted from orders when the fixed ratio is reached. The default is $200, which means that for every $400 gain, $200 is reinvested in the strategy. On the other hand, for every $400 loss, the order size is reduced by $200.
Initial capital : $1000
Fees : Interactive Broker fees apply to this strategy. They are set at 0.18% of the trade value.
Slippage : 3 ticks or $0.03 per trade. Corresponds to the latency time between the moment the signal is received and the moment the order is executed by the broker.
Important : A bot has been used to test the different parameters and determine which ones maximize return while limiting drawdown. This strategy is the most optimal on BITSTAMP:ETHUSD in 8h timeframe with the parameters set by default.
ENTER RULES :
The entry rules are very simple : we open a long position when the MACD value turns positive. You are therefore LONG when the MACD is green.
EXIT RULES :
We exit a position (whether losing or winning) when the MACD becomes negative, i.e. turns red.
RISK MANAGEMENT :
This strategy can incur losses, so it's important to manage our risks well. If the position is losing and has incurred a loss of -8%, our stop loss is activated to limit losses.
MONEY MANAGEMENT :
The fixed ratio method was used to manage our gains and losses. For each gain of an amount equal to the value of the fixed ratio, we increase the order size by a value defined by the user in the "Increasing order amount" parameter. Similarly, each time we lose an amount equal to the value of the fixed ratio, we decrease the order size by the same user-defined value. This strategy increases both performance and drawdown.
Enjoy the strategy and don't forget to take the trade :)

Bollinger Bands Strategy with Intraday Intensity IndexFor Educational Purposes. Results can differ on different markets and can fail at any time. Profit is not guaranteed.
This only works in a few markets and in certain situations. Changing the settings can give better or worse results for other markets.
This is a mean reversion strategy based on Bollinger Bands and the Intraday Intensity Index (a volume indicator). John Bollinger mentions that the Intraday Intensity Index can be used with Bollinger Bands and is one of the top indicators he recommends in his book. It seems he prefers it over the other volume indicators that he compares to for some reason. III looks a lot like Chaikin Money Flow but without the denominator in that calculation. On the default settings of the BBs, the III helps give off better entry signals. John Bollinger however is vague on how to use the BBs and it's hard to say if one should enter when it is below/above the bands or when the price crosses them. I find that with many indicators and strategies it's best to wait for a confirmation of some sort, in this case by waiting for some crossover of a band. Like most mean reversion strategies, the exit is very loose if using BBs alone. Usually the plan to exit is when the price finally reverts back to the mean or in this case the middle band. This can potentially lead to huge drawdowns and/or losses. Mean reversion strategies can have high win/loss ratios but can still end up unprofitable because of the huge losses that can occur. These drawdowns/losses that mean reversion strategies suffer from can potentially eat away at a large chunk of all that was previously made or perhaps up to all of it in the worst cases, can occur weeks or perhaps up to months after being profitable trading such a strategy, and will take a while and several trades to make it all back or keep a profitable track record. It is important to have a stop loss, trailing stop, or some sort of stop plan with these types of strategies. For this one, in addition to exiting the trade when price reverts to the middle band, I included a time-based stop plan that exits with a gain or with a loss to avoid potentially large losses, and to exit after only a few periods after taking the trade if in profit instead of waiting for the price to revert back to the mean.

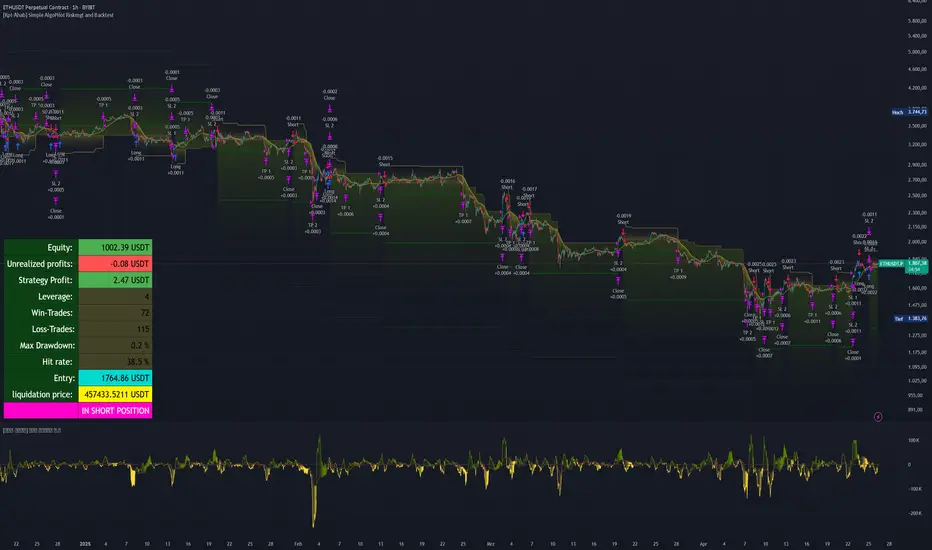
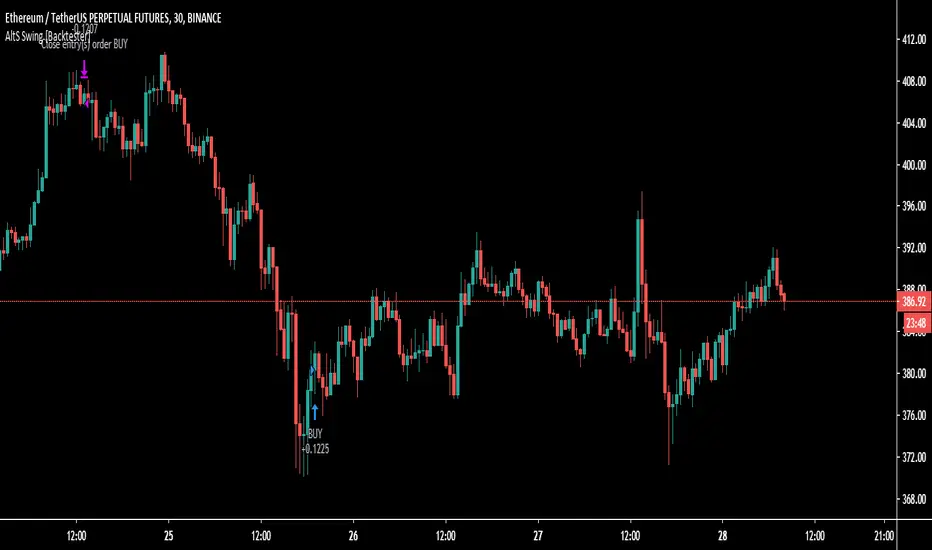
AltS Swing [Backtester]
PLEASE READ THIS DESCRIPTION TO SAVE TIME AND UNDERSTAND WHAT THIS INDICATOR DOES
This is the backtesting version for this script
In this back tested version I have shown it to be used on regular candles with realistic calculations in regards to positions sizes, slippage, fees and more
Kind Regards
This is a official version of AltSignals Long/Short Reverse Indicator
Description:
This indicator uses various indicators in combination with each other, some of the key ones to mention is Hulls, EMA , MA. Along with that it uses EMA crossovers to get the precise entries and exits.
The recommended time frames with this indictor are shorter ones, for example 5m,10m,15m work well, along with that I have found that some of the more unique time frames also work well such as 20m,45m,2hr and so on.
This indicator is not super advanced but it's still very powerful, with only 130 lines of code.
This indicator works on every chart, time, and candle type but you must play with the settings to find what is best, the same setting will not work on every pair etc.
With AltSignals Swing Indicator it trades one way, that means it gives 3 pieces of information. BUY/TakeProfit/StopLoss.
Unlike most indicators which Buy and Sell both ways this one focuses on one direction of trading so please take into account when using this.
I have added in a reverse strategy which basically shows the opposite values of of the buy, so if you select the box in the settings and un-tick it, then it will show opposite directions so sells only.
This feature is very useful especially in general bear markets when buying is difficult.
I have also added in the option for no stop losses to be used, if you set the stop loss value = 100 then it will show no stop losses.
I suggest a stop loss somewhere in the region of 1-2-3%, please note that you can use decimal stop losses too so for example 0.1 or 0.5.
This indicator is NOT a once size fits all, every chart is different, time frame and candles also, so i would suggest spending some time going through and playing with the channel length settings, which will change the EMA numbers.
Using this along with the back script to find the ideal settings is the best way to use this script, once you have done that make sure to save those values somewhere.
Its important to remember that the Regular script and the back testing script values should be the same for them to match up on the chart, so the channel lengths, stop losses and so on values should be the same.
Side note
This is not financial advice.
We will continue making updates as time goes on.
If you would like to try this script for free please visit our website or message us on Tradingview live chat.

Full Range Trading Strategy with DCA - Crypto, Forex, Stocks
Introduction
This is a Pine 4 range trading strategy. It has a twin study with several alerts. The design intent is to produce a commercial grade signal generator that can be adapted to any symbol and interval. Ideally, the script is reliable enough to be the basis of an automated trading system web-hooked to a server with API access to crypto, forex and stock brokerages. The strategy can be run in three different modes: long, short and bidirectional.
As a range trading strategy, the behavior of the script is to buy on weakness and sell on strength. As such trade orders are placed in a counter direction to price pressure. What you will see on the chart is a short position on peaks and a long position on valleys. Just to be clear, the range as well as trends are merely illusions as the chart only receives prices. However, this script attempts to calculate pivot points from the price stream. Rising pivots are shorts and falling pivots are longs. I refer to pivots as a vertex in this script which adds structural components to the chart formation. When trading in “Ping Pong” mode long and short positions are intermingled continuously as long as there exists a detectable vertex. Unfortunately, this can work against your backtest profitability on long duration trends where prices continue in a single direction without pullback. I have designed various features in the script to compensate for this event. A well configured script should perform in a range bound market and minimize losses in a trend. I also have a trend following version of this script for those not interested in trading the range. Please be aware these are two types of traders. You should know who you are.
This script employs a DCA feature which enables users to experiment with loss recovery techniques. This is an advanced feature which can increase the order size on new trades in response to stopped out or winning streak trades. The script keeps track of debt incurred from losing trades. When the debt is recovered the order size returns to the base amount specified in the TV properties tab. The inputs for this feature include a limiter to prevent your account from depleting capital during runaway markets. This implementation of DCA does not use pyramid levels. Only the order size on subsequent new trades are affected. Pyramids on the other hand increase the size of open positions. If you are interested in seeing pyramids in action please see the trend version of this script which features both DCA and pyramids. While DCA is a popular feature in crypto trading, it can make you a “bag” holder if your not careful. In other markets, especially margin trading, you’ll need a well funded account and much trading experience to manage this feature safely.
Consecutive loss limit can be set to report a breach of the threshold value. Every stop hit beyond this limit will be reported on a version 4 label above the bar where the stop is hit. Use the location of the labels along with the summary report tally to improve the adaptability of system. Don’t simply fit the chart. A good trading system should adapt to ever changing market conditions. On the study version the consecutive loss limit can be used to halt live trading on the broker side (managed manually).
Design
This script uses twelve indicators on a single time frame. The original trading algorithms are a port from a much larger program on another trading platform. I’ve converted some of the statistical functions to use standard indicators available on TradingView. The setups make heavy use of the Hull Moving Average in conjunction with EMAs that form the Bill Williams Alligator as described in his book “New Trading Dimensions” Chapter 3. Lag between the Hull and the EMAs form the basis of the entry and exit points. The vertices are calculated using one of five featured indicators. Each indicator is actually a composite of calculations which produce a distinct mean. This mathematical distinction enables the script to be useful on various instruments which belong to entirely different markets. In other words, at least one of these indicators should be able generate pivots on an arbitrarily selected instrument. Try each one to find the best fit.
The entire script is around 1800 lines of Pine code which is the maximum incidental size given the TradingView limits: local scopes, run-time duration and compile time. I’ve been working on this script for nearly two years and have tested it on various instruments stocks, forex and crypto. It performs well on higher liquidity markets that have at least a year of historical data. Although the script can be implemented on any interval, it has been optimized for small time frames down to 5 minutes. The 10 minute BTC/USD produces around 500 trades in 2 ½ months. The 1 hour BTC/USD produces around 1300 trades in 1 ½ years. Originally, this script contained both range trading and trend following logic but had to be broken into separate scripts due to the aforementioned limitations.
Inputs to the script use cone centric measurements in effort to avoid exposing adjustments to the various internal indicators. The goal was to keep the inputs relevant to the actual trade entry and exit locations as opposed to a series of MA input values and the like. As a result the strategy exposes over 50 inputs grouped into long or short sections. Inputs are available for the usual minimum profit and stop-loss as well as safeguards, trade frequency, DCA, modes, presets, reports and lots of calibrations. The inputs are numerous, I’m aware. Unfortunately, at this time, TradingView does not offer any other method to get data in the script. The usual initialization files such as cnf, cfg, ini, json and xml files are currently unsupported.
Example configurations for various instruments along with a detailed PDF user manual is available.
Indicator Repainting And Anomalies
Indicator repainting is an industry wide problem which mainly occurs when you mix backtest data with real-time data. It doesn't matter which platform you use some form of this condition will manifest itself on your chart over time. The critical aspect being whether live trades on your broker’s account continue to match your TradingView study.
Tackling this repainting issue has been a major project goal of this script. Based on my experience with Pine, most of the problems stem from TradingView’s implementation of multiple interval access. Whereas most platform provide a separate bar series for each interval requested, the Pine language interleaves higher time frames with the primary chart interval. The problem is exacerbated by allowing a look-ahead parameter to the Security function. The goal of my repaint prevention is simply to ensure that my signal trading bias remains consistent between the strategy, study and broker. That being said this is what I’ve done address this issue in this script:
1. This script uses only 1 time frame. The chart interval.
2. Every entry and exit condition is evaluated on closed bars only.
3. No security functions are called to avoid a look-ahead possibility.
4. Every contributing factor specified in the TradingView wiki regarding this issue has been addressed.
5. I’ve run a 10 minute chart live for a week and compared it to the same chart periodically reloaded. The two charts were highly correlated with no instances of completely opposite real-time signals.
The study does indeed bring up the TV warning dialog. The only reason for this is because the script uses an EMA indicator which according to TradingView is due to “peculiarities of the algorithm”.
One issue that comes up when comparing the strategy with the study is that the strategy trades show on the chart one bar later than the study. This problem is due to the fact that “strategy.entry()” and “strategy_exit()” do not execute on the same bar called. The study, on the other hand, has no such limitation since there are no position routines.
Please be aware that the data source matters. Cryptocurrency has no central tick repository so each exchange supplies TradingView its feed. Even though it is the same symbol the quality of the data and subsequently the bars that are supplied to the chart varies with the exchange. This script will absolutely produce different results on different data feeds of the same symbol. Be sure to backtest this script on the same data you intend to receive alerts for. Any example settings I share with you will always have the exchange name used to generate the test results.
Usage
The following steps provide a very brief set of instructions that will get you started but will most certainly not produce the best backtest. A trading system that you are willing to risk your hard earned capital will require a well crafted configuration that involves time, expertise and clearly defined goals. As previously mentioned, I have several example configs that I use for my own trading that I can share with you along with a PDF which describes each input in detail. To get hands on experience in setting up your own symbol from scratch please follow the steps below.
The input dialog box contains over 50 inputs separated into five sections. Each section is identified as such with a makeshift separator input. There are three main areas that must to be configured: long side, short side and settings that apply to both. The rest of the inputs apply to DCA, reporting and calibrations. The following steps address these three main areas only. You will need to get your backtest in the black before moving on to the more advanced features.
Step 1. Setup the Base currency and order size in the properties tab.
Step 2. Select the calculation presets in the Instrument Type field.
Step 3. Select “No Trade” in the Trading Mode field.
Step 4. Select the Histogram indicator from Section 2. You will be experimenting with different ones so it doesn’t matter which one you try first.
Step 5. Turn on Show Markers in Section 2.
Step 6. Go to the chart and checkout where the markers show up. Blue is up and red is down. Long trades show up along the red markers and short trades on the blue.
Step 7. Make adjustments to “Base To Vertex” and “Vertex To Base” net change and roc in Section 3. Use these fields to move the markers to where you want trades to be.
Step 8. Try a different indicator from Section 2 and repeat Step 7 until you find the best match for this instrument on this interval. This step is complete when the Vertex settings and indicator combination produce the most favorable results.
Step 9. Go to Section 3 and enable “Apply Red Base To Base Margin”.
Step 10. Go to Section 4 and enable “Apply Blue Base To Base Margin”.
Step 11. Go to Section 2 and adjust “Minimum Base To Base Blue” and “Minimum Base To Base Red”. Observe the chart and note where the markers move relative to each other. Markers further apart will produce less trades but will reduce cutoffs in “Ping Pong” mode.
Step 12. Return to Section 3 and 4 and turn off “Base To Base Margin” which was enabled in steps 9 and 10.
Step 13. Turn off Show Markers in Section 2.
Step 14. Put in your Minimum Profit and Stop Loss in the first section. This is in pips or currency basis points (chart right side scale). Percentage is not currently supported. This is a fixed value minimum profit and stop loss. Also note that the profit is taken as a conditional exit on a market order not a fixed limit. The actual profit taken will almost always be greater than the amount specified. The stop loss, on the other hand, is indeed a hard number which is executed by the TradingView broker simulator when the threshold is breached. On the study version, the stop is executed at the close of the bar.
Step 15. Return to step 3 and select a Trading Mode (Long, Short, BiDir, Ping Pong). If you are planning to trade bidirectionally its best to configure long first then short. Combine them with “BiDir” or “Ping Pong” after setting up both sides of the trade individually. The difference between “BiDir” and “Ping Pong” is that “Ping Pong” uses position reversal and can cut off opposing trades less than the specified minimum profit. As a result “Ping Pong” mode produces the greatest number of trades.
Step 16. Take a look at the chart. Trades should be showing along the markers plotted earlier.
Step 17. Make adjustments to the Vertex fields in Section 2 until the TradingView performance report is showing a profit. This includes the “Minimum Base To Base” fields. If a profit cannot be achieved move on to Step 18.
Step 18. Improve the backtest profitability by adjusting the “Long Entry Net Change” and “Long Entry ROC” in Section 3.
Step 19. Improve the backtest profitability by adjusting the “Short Entry Net Change” and “Short Entry ROC” in Section 4.
Step 20. Improve the backtest profitability by adjusting the “Sparse Long Delta” in Section 3.
Step 21. Improve the backtest profitability by adjusting the “Chase Long Delta” in Section 3.
Step 22. Improve the backtest profitability by adjusting the “Long Adherence Delta” in Section 3. This field requires the “Adhere to Rising Trend” checkbox to be enabled.
Step 23. Try each checkbox in Section 3 and see if it improves the backtest profitability. The “Caution Lackluster Longs” checkbox only works when “Long Caution Mode” is enabled.
Step 24. Improve the backtest profitability by adjusting the “Sparse Short Delta” in Section 4.
Step 25. Improve the backtest profitability by adjusting the “Chase Short Delta” in Section 4.
Step 26. Improve the backtest profitability by adjusting the “Short Adherence Delta” in Section 4. This field requires the “Adhere to Falling Trend” checkbox to be enabled.
Step 27. Try each checkbox in Section 4 and see if it improves the backtest profitability. The “Caution Lackluster Shorts” checkbox only works when “Short Caution Mode” is enabled.
Step 28. Enable the reporting conditions in Section 5. Look for long runs of consecutive losses or high debt sequences. These are indications that your trading system cannot withstand sudden changes in market sentiment.
Step 29. Examine the chart and see that trades are being placed in accordance with your desired trading goals. This is an important step. If your desired model requires multiple trades per day then you should be seeing hundreds of trades on the chart. Alternatively, you may be looking to trade fewer steep peaks and deep valleys in which case you should see trades at major turning points. Don’t simply settle for what the backtest serves you. Work your configuration until the system aligns with your desired model. Try changing indicators and even intervals if you cannot reach your simulation goals. Generally speaking, the histogram and Candle indicators produce the most trades. The Macro indicator captures the tallest peaks and valleys.
Step 30. Apply the backtest settings to the study version and perform forward testing.
This script is open for beta testing. After successful beta test it will become a commercial application available by subscription only. I’ve invested quite a lot of time and effort into making this the best possible signal generator for all of the instruments I intend to trade. I certainly welcome any suggestions for improvements. Thank you all in advance.

Hanzo Strategy - Volume & Smart Money📊 HANZO STRATEGY - Complete Description
## 🎯 Strategy Overview
The **Hanzo Strategy** is an advanced institutional trading system that combines Volume Profile analysis, Smart Money Concepts, and Price Action patterns to identify high-probability trade setups. This strategy is specifically designed for trading Gold (XAUUSD), NAS100, and US30 on the 15-minute timeframe.
---
## 🧠 Core Trading Philosophy
The Hanzo Strategy operates on the principle that **institutional money leaves footprints** in the market through:
- Volume accumulation at key price levels
- Liquidity sweeps and stop hunts
- Order block formations
- Strategic wick rejections at support/resistance
By identifying these institutional behaviors and combining them with precise volume analysis, the strategy aims to trade **with** the smart money, not against it.
---
## 🔑 Key Components
### 1️⃣ **Fixed Range Volume Profile (FRVP)**
- **What it does:** Analyzes the last 2 days of price action and calculates where the most volume traded
- **Point of Control (POC):** The price level with the highest trading volume - acts as a magnet for price
- **How we use it:** Price tends to revert to POC. When price is far from POC and starts moving toward it, we prepare for entries
- **Visual:** Yellow cross line on the chart marking the POC
### 2️⃣ **Wick Cluster Detection**
- **What it does:** Automatically identifies price levels where multiple candle wicks have rejected (2-6+ wicks)
- **Why it matters:** Multiple rejections at the same level indicate strong institutional support/resistance
- **Upper wick clusters:** Resistance zones where price was rejected downward
- **Lower wick clusters:** Support zones where price was rejected upward
- **Visual:** Dashed lines (red for resistance, green for support)
### 3️⃣ **Session Volatility Boxes**
- **London Session (8:00-16:00 UTC+3):** Captures European market volatility range
- **New York Session (13:30-20:00 UTC+3):** Captures US market volatility range
- **How we use it:** These ranges often act as support/resistance for the rest of the day
- **Visual:** Blue box for London, Orange box for New York
### 4️⃣ **Smart Money Zones**
**Order Blocks:**
- Strong institutional areas where banks and hedge funds placed large orders
- **Bullish Order Block:** Area where smart money bought heavily before a strong upward move
- **Bearish Order Block:** Area where smart money sold heavily before a strong downward move
- **Visual:** Green/Red filled boxes with "Bull OB" or "Bear OB" labels
**Liquidity Sweeps:**
- Price breaks above recent high or below recent low, then quickly reverses
- This is a "stop hunt" - institutions triggering retail stops before moving in the real direction
- **Bullish Sweep:** Price dips below support, grabs stops, then reverses up
- **Bearish Sweep:** Price pops above resistance, grabs stops, then reverses down
- **Visual:** Triangle markers (green up = bullish, red down = bearish)
### 5️⃣ **Engulfing Pattern Recognition**
- **Bullish Engulfing:** Large green candle fully engulfs the previous red candle - shows strong buying pressure
- **Bearish Engulfing:** Large red candle fully engulfs the previous green candle - shows strong selling pressure
- **How we use it:** Confirmation signal when combined with other factors
- **Visual:** Small circles below/above candles
### 6️⃣ **Trend Bias Indicator**
- Dynamically calculates market bias based on price position relative to POC
- **Bullish:** Price > 0.2% above POC
- **Neutral:** Price within 0.2% of POC
- **Bearish:** Price > 0.2% below POC
- **Visual:** Label at top of chart showing current bias
---
## 📈 Entry Signal Logic
The strategy generates **LONG** and **SHORT** signals based on confluence of multiple factors:
### 🟢 LONG ENTRY CONDITIONS:
1. **POC Break:** Price crosses above POC from below + Trend Bias is Bullish
**OR**
2. **Support Bounce:** Price touches a lower wick cluster + Bullish Engulfing pattern forms
3. **Additional Filter:** Trend Bias must NOT be Bearish
### 🔴 SHORT ENTRY CONDITIONS:
1. **POC Break:** Price crosses below POC from above + Trend Bias is Bearish
**OR**
2. **Resistance Rejection:** Price touches an upper wick cluster + Bearish Engulfing pattern forms
3. **Additional Filter:** Trend Bias must NOT be Bullish
---
## 🎯 Risk Management
### Stop Loss:
- **Calculation:** 2 × ATR(14) from entry price
- **Logic:** Uses Average True Range to adapt to current market volatility
- **Example:** If ATR = 10 points, stop loss is 20 points away
### Take Profit:
- **Calculation:** 3 × ATR(14) from entry price
- **Risk:Reward Ratio:** 1:1.5 (risking 2 ATR to make 3 ATR)
- **Example:** If ATR = 10 points, take profit is 30 points away
### Position Sizing:
- **Default:** 2% of account equity per trade
- **Adjustable:** Can be modified in strategy settings
---
## ⚙️ Strategy Settings & Customization
### Volume Profile Settings:
- **Lookback Days:** How many days to analyze (default: 2)
- **Profile Rows:** Resolution of volume calculation (default: 24)
- **POC Distance Threshold:** Minimum distance from POC for "far from POC" status (default: 0.3%)
### Wick Cluster Settings:
- **Min Wicks for Cluster:** How many wicks needed to form a cluster (default: 3)
- **Lookback Bars:** How far back to search for wicks (default: 50)
- **Tolerance %:** How close wicks must be to cluster together (default: 0.15%)
### Session Settings:
- **London Session:** 08:00-16:00 (adjustable)
- **New York Session:** 13:30-20:00 (adjustable)
- **UTC Offset:** Timezone adjustment (default: +3)
### Smart Money Settings:
- **Order Block Lookback:** How far back to search for order blocks (default: 20)
- **Toggle On/Off:** Can enable/disable order blocks and liquidity sweeps independently
---
## 📊 Performance Metrics Display
The strategy includes a real-time **Information Table** (top-right corner) showing:
| Metric | Description |
|--------|-------------|
| **Trend Bias** | Current market direction (Bullish/Neutral/Bearish) |
| **POC Price** | Current Point of Control price level |
| **Distance from POC** | How far current price is from POC (%) |
| **ATR (14)** | Current volatility measurement |
| **High Wick Clusters** | Number of resistance clusters detected |
| **Low Wick Clusters** | Number of support clusters detected |
| **Current Signal** | Active signal (LONG/SHORT/None) |
---
## 🚨 Alert System
The strategy can send alerts for:
1. **LONG Signal Triggered** - When all conditions met for long entry
2. **SHORT Signal Triggered** - When all conditions met for short entry
3. **Price Touching Support Cluster** - Warning that price at key support
4. **Price Touching Resistance Cluster** - Warning that price at key resistance
**Alert Frequency:** Once per bar (prevents spam)
---
## 📅 Best Trading Timeframes & Instruments
### ✅ Recommended Timeframes:
- **Primary Entry:** 15-minute chart
- **Trend Confirmation:** 30-minute or 1-hour chart
- **Higher Timeframe Filter:** 4-hour for major trend direction
### ✅ Recommended Instruments:
1. **Gold (XAUUSD)** - High volatility, respects key levels well
2. **NAS100 (US Tech 100)** - Strong trends, good liquidity
3. **US30 (Dow Jones)** - Reliable institutional participation
4. **EUR/USD, GBP/USD** - Can work on major forex pairs with adjustments
### ⏰ Best Trading Sessions:
- **London Open (08:00-12:00 UTC+3)** - High volatility, clear directional moves
- **New York Open (13:30-17:00 UTC+3)** - Strongest moves, highest volume
- **Overlap (13:30-16:00 UTC+3)** - Best liquidity and movement
### ⚠️ Avoid Trading:
- Asian session (low volatility)
- Major news events (first 15 minutes after high-impact news)
- Sundays and holidays (low liquidity)
---
## 💡 Pro Trading Tips
### 1. **Multiple Timeframe Confirmation**
- Check 1-hour chart for overall trend before taking 15-minute signals
- Only take LONG signals if 1-hour is bullish
- Only take SHORT signals if 1-hour is bearish
### 2. **POC Strategy**
- Best entries occur when price returns to POC after being far away
- Wait for POC touch + confirmation pattern (engulfing, order block)
- POC acts as support in uptrends, resistance in downtrends
### 3. **Wick Cluster Strategy**
- Strongest signals occur when wick clusters align with POC
- Look for 4+ wicks at the same level for highest probability
- Recent clusters (formed in last 2 days) are stronger than old ones
### 4. **Order Block Strategy**
- Fresh order blocks (just formed) are more powerful
- Wait for price to return to order block zone before entering
- Best when order block + wick cluster occur at same level
### 5. **London/NY Box Strategy**
- If price breaks above session high → look for LONG pullback entries
- If price breaks below session low → look for SHORT pullback entries
- Price often returns to session mid-point before continuing
### 6. **Risk Management Rules**
- **Never risk more than 2% per trade**
- **Don't trade more than 3 positions simultaneously**
- **If 2 losses in a row, reduce size to 1% or stop for the day**
- **Move stop to breakeven after 1:1 profit reached**
### 7. **High-Probability Setups**
Look for **CONFLUENCE** - the more factors aligned, the better:
✅ **BEST LONG SETUP:**
- Price at lower wick cluster (support)
- Price at/near POC
- Bullish order block present
- Bullish engulfing pattern forms
- Trend Bias = Bullish
- 1-hour chart = uptrend
✅ **BEST SHORT SETUP:**
- Price at upper wick cluster (resistance)
- Price at/near POC
- Bearish order block present
- Bearish engulfing pattern forms
- Trend Bias = Bearish
- 1-hour chart = downtrend
---
## 📈 Performance Expectations
### Typical Win Rate:
- **Conservative Trading (high confluence only):** 55-65% win rate
- **Moderate Trading (good setups):** 45-55% win rate
- **Aggressive Trading (all signals):** 35-45% win rate
### Typical Risk:Reward:
- **Average R:R:** 1:1.5 (with 2 ATR stop and 3 ATR target)
- **Breakeven adjusted:** Often improves to 1:2+ when stop moved to BE
### Monthly Trade Frequency (15M chart):
- **Gold:** 60-100 signals per month
- **NAS100:** 50-80 signals per month
- **US30:** 40-70 signals per month
---
## 🎓 Strategy Philosophy Summary
The Hanzo Strategy is built on three core principles:
1. **Follow the Volume** - Trade where institutions are active
2. **Respect the Levels** - Key support/resistance zones matter
3. **Confirm with Price Action** - Wait for confirmation before entering
This is NOT a holy grail - it requires:
- ✅ Discipline to wait for proper setups
- ✅ Patience to let trades play out
- ✅ Risk management to protect capital
- ✅ Emotional control to handle losses
---
## 🛠️ How to Use This Strategy
### Step 1: Initial Setup
1. Add strategy to 15-minute chart
2. Check that all components are visible (POC, clusters, boxes, etc.)
3. Adjust colors if needed for your chart theme
### Step 2: Daily Routine
1. **Pre-Market (before 8:00 AM):**
- Check POC location
- Note wick clusters from previous days
- Mark London/NY session boxes from yesterday
2. **London Session (8:00-16:00):**
- Watch for POC interactions
- Monitor for order blocks forming
- Wait for confluence setups
3. **NY Session (13:30-20:00):**
- Highest activity period
- Best signal quality
- More aggressive entries allowed
### Step 3: Trade Execution
1. Wait for signal label (LONG or SHORT) to appear
2. Check confluence factors (minimum 3)
3. Enter immediately or on next candle
4. Set stop loss at 2 × ATR from entry
5. Set take profit at 3 × ATR from entry
6. Move stop to breakeven at +1.5 ATR profit
### Step 4: Trade Management
- **Don't move stop closer** (let trade breathe)
- **Can trail stop** after 2:1 profit reached
- **Can take partial profits** at 1.5:1 and let rest run
- **Journal every trade** for future improvement
---
## ⚠️ Important Disclaimers
1. **Past performance does not guarantee future results**
2. **This strategy involves risk** - only trade with money you can afford to lose
3. **Backtest thoroughly** on your specific instruments before live trading
4. **Start small** - test with minimum position sizes first
5. **Market conditions change** - what works today may not work tomorrow
6. **Use proper risk management** - this is the #1 key to long-term success
---
## 🎯 Quick Reference Checklist
Before taking any trade, ask yourself:
- ✅ Is there a clear LONG or SHORT signal?
- ✅ Are we in London or NY session?
- ✅ Is price at/near POC or wick cluster?
- ✅ Is trend bias aligned with my direction?
- ✅ Is there an order block or engulfing pattern?
- ✅ Is my risk:reward at least 1:1.5?
- ✅ Am I risking no more than 2% of my account?
**If 5+ are YES → Take the trade!**
**If 3 or fewer YES → Skip and wait for better setup!**
---
## 🚀 Final Words
The Hanzo Strategy is a professional-grade trading system that combines institutional analysis with precise technical execution. Success comes not from taking every signal, but from taking only the **highest probability setups** with proper risk management.
**Trade smart. Trade safe. Trade like an institution.**
📊 **Good luck and profitable trading!** 📊

Candle Breakout StrategyShort description (one-liner)
Candle Breakout Strategy — identifies a user-specified candle (UTC time), draws its high/low range, then enters on breakouts with configurable stop-loss, take-profit (via Risk:Reward) and optional alerts.
Full description (ready-to-paste)
Candle Breakout Strategy
Version 1.0 — Strategy script (Pine v5)
Overview
The Candle Breakout Strategy automatically captures a single "range candle" at a user-specified UTC time, draws its high/low as a visible box and dashed level lines, and waits for a breakout. When price closes above the range high it enters a Long; when price closes below the range low it enters a Short. Stop-loss is placed at the opposite range boundary and take-profit is calculated with a user-configurable Risk:Reward multiplier. Alerts for entries can be enabled.
This strategy is intended for breakout style trading where a clearly defined intraday range is established at a fixed time. It is simple, transparent and easy to adapt to multiple symbols and timeframes.
How it works (step-by-step)
On every bar the script checks the current UTC time.
When the first bar that matches the configured Target Hour:Target Minute (UTC) appears, the script records that candle’s high and low. This defines the breakout range.
A box and dashed lines are drawn on the chart to display the range and extended to the right while the range is active.
The script then waits for price to close outside the box:
Close > Range High → Long entry
Close < Range Low → Short entry
When an entry triggers:
Stop-loss = opposite range boundary (range low for longs, range high for shorts).
Take-profit = entry ± (risk × Risk:Reward). Risk is computed as the distance between entry price and stop-loss.
After entry the range becomes inactive (waitingForBreakout = false) until the next configured target time.
Inputs / Parameters
Target Hour (UTC) — the hour (0–23) in UTC when the range candle is detected.
Target Minute — minute (0–59) of the target candle.
Risk:Reward Ratio — multiplier for computing take profit from risk (0.5–10). Example: 2 means TP = entry + 2×risk.
Enable Alerts — turn on/off entry alerts (string message sent once per bar when an entry occurs).
Show Last Box Only (internal behavior) — when enabled the previous box is deleted at the next range creation so only the most recent range is visible (default behavior in the script).
Visuals & On-chart Info
A semi-transparent blue box shows the recorded range and extends to the right while active.
Dashed horizontal lines mark the range high and low.
On-chart shapes: green triangle below bar for Long signals, red triangle above bar for Short signals.
An information table (top-right) displays:
Target Time (UTC)
Active Range (Yes / No)
Range High
Range Low
Risk:Reward
Alerts
If Enable Alerts is on, the script sends an alert with the following formats when an entry occurs:
Long alert:
🟢 LONG SIGNAL
Entry Price:
Stop Loss:
Take Profit:
Short alert:
🔴 SHORT SIGNAL
Entry Price:
Stop Loss:
Take Profit:
Use TradingView's alert dialog to create alerts based on the script — select the script’s alert condition or use the alert() messages.
Recommended usage & tips
Timeframe: This strategy works on any timeframe but the definition of "candle at target time" depends on the chart timeframe. For intraday breakout styles, use 1m — 60m charts depending on the session you want to capture.
Target Time: Choose a time that is meaningful for the instrument (e.g., market open, economic release, session overlap). All times are handled in UTC.
Position Sizing: The script’s example uses strategy.percent_of_equity with 100% default — change default_qty_value or strategy settings to suit your risk management.
Filtering: Consider combining this breakout with trend filters (EMA, ADX, etc.) to reduce false breakouts.
Backtesting: Always backtest over a sufficiently large and recent sample. Pay attention to slippage and commission settings in TradingView’s strategy tester.
Known behavior & limitations
The script registers the breakout on close outside the recorded range. If you prefer intrabar breakout rules (e.g., high/low breach without close), you must adjust the condition accordingly.
The recorded range is taken from a single candle at the exact configured UTC time. If there are missing bars or the chart timeframe doesn't align, the intended candle may differ — choose the target time and chart timeframe consistently.
Only a single active position is allowed at a time (the script checks strategy.position_size == 0 before entries).
Example setups
EURUSD (Forex): Target Time 07:00 UTC — captures London open range.
Nifty / Index: Target Time 09:15 UTC — captures local session open range.
Crypto: Target Time 00:00 UTC — captures daily reset candle for breakout.
Risk disclaimer
This script is educational and provided as-is. Past performance is not indicative of future results. Use proper risk management, test on historical data, and consider slippage and commissions. Do not trade real capital without sufficient testing.
Change log
v1.0 — Initial release: range capture, box and level drawing, long/short entry by close breakout, SL at opposite boundary, TP via Risk:Reward, alerts, info table.
If you want, I can also:
Provide a short README version (2–3 lines) for the TradingView “Short description” field.
Add a couple of suggested alert templates for the TradingView alert dialog (if you want alerts that include variable placeholders).
Convert the disclaimer into multiple language versions.

Strategy with Reference Lines📊 Strategy with Reference Lines
Description:
This strategy uses a contrarian approach based on the analysis of the previous candle to identify entry and exit points. The strategy draws horizontal reference lines at important levels of the previous candle and generates buy/sell signals based on the candle's direction.
Key Features:
🔹 Multi-Timeframe Analysis: Configurable for 1H, 2H, 3H, 4H, 6H, 12H, and 1D
🔹 Reference Lines: High, low, close, and midpoint (50%) of the previous candle
🔹 Visual Signals: Labels with prices and actions (BUY/SELL/TP)
🔹 Optional Trading: Enable/disable automatic order execution
🔹 Complete System: Automatic entry, Take Profit, and Stop Loss
🔹 Alerts: Notifications when a new candle is detected
Strategy Logic:
When the previous candle is POSITIVE:
Signal: 🔴 SELL at the previous candle's close
Take Profit: 🎯 Midpoint (50%) of the previous candle
Stop Loss: 🔴 High of the previous candle
When the previous candle is NEGATIVE:
Signal: 🟢 BUY at the previous candle's close
Take Profit: 🎯 Midpoint (50%) of the previous candle
Stop Loss: 🟢 Low of the previous candle
Visual Elements:
Green Line: High of the previous candle (when positive)
Red Line: Low of the previous candle (when negative)
Yellow Line: Close of the previous candle (always present)
Blue Line: Midpoint (50%) of the previous candle (always present)
Labels: Prices and actions with emojis for easy identification
Settings:
Timeframe: Default 4H (configurable)
Auto Trading: Disabled by default (safety)
Alerts: Include entry prices, TP, and SL
Recommended Usage:
✅ Visual Analysis: Use with trading disabled for analysis
✅ Backtesting: Enable trading to test historically
✅ Swing Trading: Ideal for 4H or higher timeframes
✅ Risk Management: Automatic SL and TP for protection
Risk Disclaimer:
This strategy is for educational and analysis purposes only. Always test in a simulation environment before using with real capital. Trading involves significant risks and may result in losses.

Weekend Hunter Ultimate v6.2 Weekend Hunter Ultimate v6.2 - Automated Crypto Weekend Trading System
OVERVIEW:
Specialized trading strategy designed for cryptocurrency weekend markets (Saturday-Sunday) when institutional traders are typically offline and market dynamics differ significantly from weekdays. Optimized for 15-minute timeframe execution with multi-timeframe confluence analysis.
KEY FEATURES:
- Weekend-Only Trading: Automatically activates during configurable weekend hours
- Dynamic Leverage: 5-20x leverage adjusted based on market safety and signal confidence
- Multi-Timeframe Analysis: Combines 4H trend, 1H momentum, and 15M execution
- 10 Pre-configured Crypto Pairs: BTC, ETH, LINK, XRP, DOGE, SOL, AVAX, PEPE, TON, POL
- Position & Risk Management: Max 4 concurrent positions, -30% account protection
- Smart Trailing Stops: Protects profits when approaching targets
RISK MANAGEMENT:
- Maximum daily loss: 5% (configurable)
- Maximum weekend loss: 15% (configurable)
- Per-position risk: Capped at 120-156 USDT
- Emergency stops for flash crashes (8% moves)
- Consecutive loss protection (4 losses = pause)
TECHNICAL INDICATORS:
- CVD (Cumulative Volume Delta) divergence detection
- ATR-based dynamic stop loss and take profit
- RSI, MACD, Bollinger Bands confluence
- Volume surge confirmation (1.5x average)
- Weekend liquidity adjustments
INTEGRATION:
- Designed for Bybit Futures (0.075% taker fee)
- WunderTrading webhook compatibility via JSON alerts
- Minimum position size: 120 USDT (Bybit requirement)
- Initial capital: $500 recommended
TARGET METRICS:
- Win rate target: 65%
- Average win: 5.5%
- Average loss: 1.8%
- Risk-reward ratio: ~3:1
IMPORTANT DISCLAIMERS:
- Past performance does not guarantee future results
- Leveraged trading carries substantial risk of loss
- Weekend crypto markets have 13% of normal liquidity
- Not suitable for traders who cannot afford to lose their entire investment
- Requires continuous monitoring and adjustment
USAGE:
1. Apply to 15-minute charts only
2. Configure weekend hours for your timezone
3. Set up webhook alerts for automation
4. Monitor performance table in top-right corner
5. Adjust parameters based on your risk tolerance
This is an experimental strategy for educational purposes. Always test with small amounts first and never invest more than you can afford to lose completely.

Intraday Alpha Pro - ORB + Trend/MomentumOverview
This is a pure intraday trading strategy designed for active traders seeking to capitalize on short-term price movements using two complementary modules: Opening Range Breakout (ORB) and Trend/Momentum. The strategy operates strictly within a user-defined trading session, automatically flattening all positions at session end to avoid overnight carry. It employs a points-based exit system with a trailing stop that activates only after the target is reached, ensuring disciplined risk management. Optional Martingale position sizing is included for users who prefer aggressive scaling after losses.Key Features Pure Intraday, No Carry: Trades are confined to a user-defined session (default: 9:15 AM–3:25 PM, Monday–Sunday). All positions are closed at session end.
Non-Repainting: Entries are evaluated only on confirmed bar closes (barstate.isconfirmed), ensuring no lookahead or repainting.
Dual Signal Modules: Opening Range Breakout (ORB): Captures breakouts above/below the high/low of a user-defined opening range (default: 9:15 AM–9:30 AM).
Trend/Momentum: Combines EMA (9/21) crossovers, RSI filters, volume confirmation, and an optional 200-period MA trend filter for robust trend-following signals.
Points-Based Exits: Uses fixed stop-loss (slPoints, default 16 points) and take-profit (tpPoints, default 32 points) distances. Once the take-profit level is reached, a trailing stop (trailDistPts, default 10 points) activates, ratcheting monotonically to lock in gains.
Martingale Sizing (Optional): Allows position size increases after losses (up to maxQtyInput) with a reset option after wins.
Cooldown Period: Prevents immediate re-entries after exits using a configurable cooldown (cooldownBars).
Flexible Inputs: Toggle long/short entries, enable/disable ORB or Trend/Momentum modules, and customize all parameters (e.g., MA lengths, RSI thresholds, volume multiplier).
Visuals & Alerts: Plots ORB high/low lines and moving averages (9, 21, 200). Includes alerts for long/short entries and end-of-day flattening.
How It Works Session Management: Trades only within the specified tradeSes (default: 9:15 AM–3:25 PM). The ORB module uses a separate orbSes (default: 9:15 AM–9:30 AM) to calculate breakout levels. Positions are closed automatically at session end.
Entry Conditions: ORB: Long when price closes above the ORB high after the ORB session ends; short when price closes below the ORB low.
Trend/Momentum: Long on fast MA (default EMA 9) crossing above slow MA (default EMA 21), with RSI above rsiBuy (default 55), volume exceeding volMult (default 1.5x prior bar), and price above the 200-period MA (if enabled). Shorts use the inverse.
Exit Logic: Stop-loss is set at entry price ± slPoints.
Take-profit is monitored using a running high/low since entry. Once price moves tpPoints in profit, the stop trails at trailDistPts behind the current price, adjusting only in the favorable direction (never loosening).
Exits use strategy.exit with stop only (no limit orders).
Position Sizing: Default size is baseQtyInput (minimum 1 contract). With useMartingale enabled, size increases by martingaleFactor after a loss, capped at maxQtyInput. If resetOnWin is true, size resets to baseQtyInput after a winning trade.
Cooldown: After an exit, no new trades are allowed for cooldownBars to prevent overtrading.
Futures-Safe Volume: Volume filter accommodates markets with missing or zero volume data (e.g., futures), ensuring signals aren’t blocked unnecessarily.
Inputs Trading Session: tradeSes (e.g., "0915-1525:1234567") and orbSes (e.g., "0915-0930:1234567").
Toggles: enableLong, enableShort, useORB, useTrendMom, useTrendFilter (200-MA).
Trend/Momentum: maType (EMA/SMA), fastLen (9), slowLen (21), trendLen (200), rsiLen (14), rsiBuy (55), rsiSell (45), volMult (1.5).
Exits: slPoints (16), tpPoints (32), trailDistPts (10).
Martingale: useMartingale, baseQtyInput, maxQtyInput, martingaleFactor, resetOnWin.
Cooldown: cooldownBars (1).
Legacy (Ignored): tp1RR, tp2RR, tp3RR, tp1Pct, tp2Pct, tp3Pct, stepTrail for backward compatibility.
Usage Notes Best suited for liquid, intraday markets (e.g., futures like ES, NQ, or forex pairs).
Adjust slPoints, tpPoints, and trailDistPts to match instrument volatility.
Use useMartingale cautiously, as it increases risk after losses.
Ensure tradeSes and orbSes align with your market’s trading hours.
Alerts can be set for long/short entries and EOD flattening.
The strategy avoids lookahead and repainting, ensuring reliability in live trading.
Risk Warning
Trading involves significant risk. Backtest thoroughly and use appropriate risk management. The Martingale option can amplify losses if not carefully monitored. Past performance is not indicative of future results.

Long Term Profitable Swing | AbbasA Story of a Profitable Swing Trading Strategy
Imagine you're sailing across the ocean, looking for the perfect wave to ride. Swing trading is quite similar—you're navigating the stock market, searching for the ideal moments to enter and exit trades. This strategy, created by Abbas, helps you find those waves and ride them effectively to profitable outcomes.
🌊 Finding the Perfect Wave (Entry)
Our journey begins with two simple signs that tell us a great trading opportunity is forming:
- Moving Averages: We use two lines that follow price trends—the faster one (EMA 16) reacts quickly to recent price moves, and the slower one (EMA 30) gives us a longer-term perspective. When the faster line crosses above the slower line, it's like a clear signal saying, "Hey! The wave is rising, and prices might move higher!"
- RSI Momentum: Next, we check a tool called the RSI, which measures momentum (how strongly prices are moving). If the RSI number is above 50, it means there's enough strength behind this rising wave to carry us forward.
When both signals appear together, that's our green light. It's time to jump on our surfboard and start riding this promising wave.
⚓ Safely Riding the Wave (Risk Management)
While we're riding this wave, we want to ensure we're safe from sudden surprises. To do this, we use something called the Average True Range (ATR), which measures how volatile (or bumpy) the price movements are:
- Stop-Loss: To avoid falling too hard, we set a safety line (stop-loss) 8 times the ATR below our entry price. This helps ensure we exit if the wave suddenly turns against us, protecting us from heavy losses.
- Take Profit: We also set a goal to exit the trade at 11 times the ATR above our entry. This way, we capture significant profits when the wave reaches a nice high point.
🌟 Multiple Rides, Bigger Adventures
This strategy allows us to take multiple positions simultaneously—like riding several waves at once, up to 5. Each trade we make uses only 10% of our trading capital, keeping risks manageable and giving us multiple opportunities to win big.
🗺️ Easy to Follow Settings
Here are the basic settings we use:
- Fast EMA**: 16
- Slow EMA**: 30
- RSI Length**: 9
- RSI Threshold**: 50
- ATR Length**: 21
- ATR Stop-Loss Multiplier**: 8
- ATR Take-Profit Multiplier**: 11
These settings are flexible—you can adjust them to better suit different markets or your personal trading style.
🎉 Riding the Waves of Success
This simple yet powerful swing trading approach helps you confidently enter trades, clearly know when to exit, and effectively manage your risk. It’s a reliable way to ride market waves, capture profits, and minimize losses.
Happy trading, and may you find many profitable waves to ride! 🌊✨
Please test, and take into account that it depends on taking multiple longs within the swing, and you only get to invest 25/30% of your equity.

Heiken Ashi Supertrend ATR-SL StrategyThis indicator combines Heikin Ashi candle pattern analysis with Supertrend to generate high-probability trading signals with built-in risk management. It identifies potential entries and exits based on specific Heikin Ashi candlestick formations while providing automated ATR-based stop loss management.
Trading Logic:
The system generates long signals when a green Heikin Ashi candle forms with no bottom wick (indicating strong bullish momentum). Short signals appear when a red Heikin Ashi candle forms with no top wick (showing strong bearish momentum). The absence of wicks on these candles signals a high-conviction market move in the respective direction.
Exit signals are triggered when:
1. An opposite pattern forms (red candle with no top wick exits longs; green candle with no bottom wick exits shorts)
2. The ATR-based stop loss is hit
3. The break-even stop is activated and then hit
Technical Approach:
- Select Heiken Ashi Canldes on your Trading View chart. Entried are based on HA prices.
- Supertrend and ATR-based stop losses use real price data (not HA values) for trend determination
- ATR-based stop losses automatically adjust to market volatility
- Break-even functionality moves the stop to entry price once price moves a specified ATR multiple in your favor
Risk Management:
- Default starting capital: 1000 units
- Default risk per trade: 10% of equity (customizable in strategy settings)
- Hard Stop Loss: Set ATR multiplier (default: 2.0) for automatic stop placement
- Break Even: Configure ATR threshold (default: 1.0) to activate break-even stops
- Appropriate position sizing relative to equity and stop distance
Customization Options:
- Supertrend Settings:
- Enable/disable Supertrend filtering (trade only in confirmed trend direction)
- Adjust Factor (default: 3.0) to change sensitivity
- Modify ATR Period (default: 10) to adapt to different timeframes
Visual Elements:
- Green triangles for long entries, blue triangles for short entries
- X-marks for exits and stop loss hits
- Color-coded position background (green for long, blue for short)
- Clearly visible stop loss lines (red for hard stop, white for break-even)
- Comprehensive position information label with entry price and stop details
Implementation Notes:
The indicator tracks positions internally and maintains state across bars to properly manage stop levels. All calculations use confirmed bars only, with no repainting or lookahead bias. The system is designed for swing trading on timeframes from 1-hour and above, where Heikin Ashi patterns tend to be more reliable.
This indicator is best suited for traders looking to combine the pattern recognition strengths of Heikin Ashi candles with the trend-following capabilities of Supertrend, all while maintaining disciplined risk management through automated stops.

Flux Charts - S&D Automation💎 GENERAL OVERVIEW
The MTF Supply & Demand Zones (S&D) Automation is a powerful and versatile tool designed to help traders rigorously test their trading strategies against historical market data. With various advanced settings, traders can fine-tune their strategies, assess performance, and identify key improvements before deploying in live trading environments. This tool offers a wide range of configurable settings, explained within this write-up.
Features of the new S&D Automation:
Step By Step : Configure your strategy step by step, which will allow you to have OR & AND logic in your strategies.
Highly Configurable : Offers multiple parameters for fine-tuning trade entry and exit conditions.
Multi-Timeframe Analysis : Allows traders to analyze multiple timeframes simultaneously for enhanced accuracy.
Provides advanced stop-loss, take-profit, and break-even settings.
Incorporates Supply & Demand Zone conditions, with settings like Sensitivity, Zone Invalidation, Minimum Zone Width & Minimum Zone Length settings for refined strategy execution.
🚩 UNIQUENESS
The S&D Automation stands out from conventional backtesting tools due to its unparalleled flexibility, precision, and advanced trading logic integration. Key factors that make it unique include:
✅ Comprehensive Strategy Customization – Unlike traditional backtesters that offer basic entry and exit conditions, S&D Automation provides a highly detailed parameter set, allowing traders to fine-tune their strategies with precision.
✅ Multi-Timeframe Supply & Demand Zones – This is the first-ever tool that allows traders to backtest Supply & Demand zones on multiple timeframes.
✅ Customizable Take-Profit Conditions – Offers various methods to set take-profit exits, including using core features from Supply & Demand Zones, and fixed exits like ATR, % change or price change, enabling traders to tailor their exit strategies to specific market behaviors.
✅ Customizable Stop-Loss Conditions – Provides several ways to set up stop losses, including using concepts from Supply & Demand Zones and trailing stops or fixed exits like ATR, % change or price change, allowing for dynamic risk management tailored to individual strategies.
✅ Integration of External Indicators – Allows the inclusion of other indicators or data sources from TradingView for creating strategy conditions, enabling traders to enhance their strategies with additional insights and data points.
By integrating these advanced features, S&D Automation ensures that traders can rigorously test and optimize their strategies with great accuracy and efficiency.
📌 HOW DOES IT WORK ?
The first setting you will want to set it the pyramiding setting. This setting controls the number of simultaneous trades in the same direction allowed in the strategy. For example, if you set it to 1, only one trade can be active in any time, and the second trade will not be entered unless the first one is exited. If it is set to 2, the script will handle both of them at the same time. Note that you should enter the same value to this pyramiding setting, and the pyramiding setting in the "Properties" tab of the script for this to work.
You can enable and set a backtesting window that will limit the entries to between the start date & end date.
Then, you can enter your desired settings for Supply & Demand Zones. You can also enable and set up to 3 timeframes, which you can use later on when customizing your strategies enter / exit conditions.
Entry Conditions
From the "Long Conditions" or the "Short Conditions" groups, you can set your position entry conditions. For settings like "initial capital" or "order size", you can open the "Properties" tab, where these are handled.
The S&D Automation can use the following conditions for entry conditions :
1. Demand Zone
Detection: Triggered when a Demand Zone forms or is detected
Retest: Triggered when price retests a Demand Zone. A retest is confirmed when a candle enters a Demand Zone and closes outside of it.
2nd Retest: Triggered when price retests a Demand Zone for the second time. A retest is confirmed when a candle enters a Demand Zone and closes outside of it.
3rd Retest: Triggered when price retests a Demand Zone for the third time. A retest is confirmed when a candle enters a Demand Zone and closes outside of it.
Retracement: Triggered when price touches a Demand Zone
Break: Triggered when a Demand Zone is invalidated by candle close or wick, depending on the user's input.
2. Supply Zone
Detection: Triggered when a Supply Zone forms or is detected
Retest: Triggered when price retests a Supply Zone. A retest is confirmed when a candle enters a Supply Zone and closes outside of it.
2nd Retest: Triggered when price retests a Supply Zone for the second time. A retest is confirmed when a candle enters a Supply Zone and closes outside of it.
3rd Retest: Triggered when price retests a Supply Zone for the third time. A retest is confirmed when a candle enters a Supply Zone and closes outside of it.
Retracement: Triggered when price touches a Supply Zone
Break: Triggered when a Supply Zone is invalidated by candle close or wick, depending on the user's input.
3. Any Zone
Detection: Triggered when any Supply or Demand Zone forms or is detected
Retest: Triggered when price retests any Supply or Demand Zone. A retest is confirmed when a candle enters any Supply or Demand Zone and closes outside of it.
2nd Retest: Triggered when price retests any Supply or Demand Zone for the second time. A retest is confirmed when a candle enters any Supply or Demand Zone and closes outside of it.
3rd Retest: Triggered when price retests any Supply or Demand Zone for the third time. A retest is confirmed when a candle enters any Supply or Demand Zone and closes outside of it.
Retracement: Triggered when price touches any Supply or Demand Zone
Break: Triggered when any Supply or Demand Zone is invalidated by candle close or wick, depending on the user's input.
🕒 TIMEFRAME CONDITIONS
The S&D Automation supports Multi-Timeframe (MTF) features, just like the Supply & Demand indicator. When setting an entry condition, you can also choose the timeframe.
To set up MTF conditions, navigate to the 'Timeframes' section in the settings, select your desired timeframes, and enable them. You can choose up to three timeframes.
Once you've selected your timeframes, you can use them in your strategy. When setting long and short entry/exit conditions, you can choose from Timeframe 1, Timeframe 2, or Timeframe 3.
External Conditions
Users can use external indicators on the chart to set entry conditions.
The second dropdown in the external condition settings allows you to choose a conditional operator to compare external outputs. Available options include:
Less Than or Equal To: <=
Less Than: <
Equal To: =
Greater Than: >
Greater Than or Equal To: >=
The position entry conditions work like this ;
Each side has 5 S&D Zone conditions and 1 Source condition. Each condition can be enabled or disabled using the checkbox on the left side of them.
The next selection is the alert type, which you can select between "Detection", "Retest", "Retracement" or "Break".
You can select which timeframe this condition should work on from Timeframe 1, 2, or 3. If you select "Any Timeframe", the condition will work for all timeframes.
Lastly select the step of this condition from 1 to 6.
The Source Condition
The last condition on each side is a source condition that is different from the others. Using this condition, you can create your own logic using other indicators' outputs on your chart. For example, suppose that you have an EMA indicator in your chart. You can have the source condition to something like "EMA > high".
The Step System
Each condition has a step number, and conditions are in topological order based on them.
The conditions are executed step by step. This means the condition with step 2 cannot be executed before the condition with step 1 is executed.
Conditions with the same step numbers have "OR" logic. This means that if you have 2 conditions with step 3, the condition with step 4 can trigger after only one of the step 3 conditions is executed.
➕ OTHER ENTRY FEATURES
The S&D Automation allows traders to choose when to execute trades and when not to execute trades.
1. Only Take Trades
This setting lets users specify the time period when their strategy can open or execute trades.
2. Don't Take Trades
This setting lets users specify time periods when their strategy can't open or execute trades.
↩️ EXIT CONDITIONS
1. Exit on Opposite Signal
When enabled, a long position will close when short entry conditions are met, and a short position will close when long entry conditions are met.
2. Exit on Session End
When enabled, positions will be closed at the end of the trading session.
📈 TAKE PROFIT CONDITIONS
There are several methods available for setting take profit exits and conditions.
1. Entry Condition TP
Users can use entry conditions as triggers for take-profit exits. This setting can be found under the long and short exit conditions.
2. Fixed TP
Users can set a fixed TP for exits. This setting can be found under the long and short exit conditions. Users can choose between the following:
Price: This method triggers a TP exit when price reaches a specified level. For example, if you set the Price TP to 10 and buy NASDAQ:TSLA at $190, the trade will automatically exit when the price reaches $200 ($190 + $10).
Ticks: This method triggers a TP exit when price moves a specified number of ticks.
Percentage (%): This method triggers a TP exit when price moves a specified percentage.
ATR: This method triggers a TP exit based on a specified multiple of the Average True Range (ATR).
📉 STOP LOSS CONDITIONS
There are several methods available for setting stop-loss exits and conditions.
1. Entry Condition SL
Users can use entry conditions as triggers for stop-loss exits. This setting can be found under the long and short exit conditions.
2. Fixed SL
Users can set a fixed SL for exits. This setting can be found under the long and short exit conditions. Users can choose between the following:
Price: This method triggers a SL exit when price reaches a specified level. For example, if you set the Price SL to 10 and buy NASDAQ:TSLA at $200, the trade will automatically exit when the price reaches $190 ($200 - $10).
Ticks: This method triggers a SL exit when price moves a specified number of ticks.
Percentage (%): This method triggers a SL exit when price moves a specified percentage.
ATR: This method triggers a SL exit based on a specified multiple of the Average True Range (ATR).
3. Trailing Stop
An explanation & example for the trailing stop feature is present on the write-up within the next section.
Exit conditions have the same logic of constructing conditions like the entry ones. You can construct a Take-Profit Condition & a Stop-Loss Condition. Note that the Take-Profit condition will only work if the position is in profit, regardless of if it's triggered or not. The same applies for the Stop-Loss condition, meaning that it will only work if the position is in loss.
You can also set a Fixed TP & Fixed SL based on the price movement after the position is entered. You have options like "Price", "Ticks", "%", or "Average True Range". For example, you can set a Fixed TP like "5%", and the position will be entered once it moves 5% up in a long position.
Trailing Stop
For the Fixed SL, you also have a "Trailing" stop option, for which you can set its activation level as well. The Trailing stop activation level and its value are expressed in ticks. Check this scenario for an example :
We have a ticker with a tick value of $1. Our Trailing Stop is set to 10 ticks, and the activation level is set to 30 ticks.
We buy 1 contract when the price is $100.
When the price becomes $110, we are in $10 (10 ticks) profit and the trailing stop is now activated.
The current price our stop's on is $110 - $30 (30 ticks), which is the level of $80.
The trailing stop will only move if the price moves up the highest high the price has been after we entered the position.
Let's suppose that price moves up $40 right after our trailing stop is activated. The price will now be $150, and our trailing stop will sit on $150 - $30 (30 ticks) = $120.
If the price is down the $120 level, our stop loss will be triggered.
There is also a "Hard SL" option designed for a backup stop-loss when trailing stops are enabled. You can enable & set this option and if the price goes down before our trailing stop even activates, the position will be exited.
You can also move stop-loss to the break-even (entry price of the position) after a certain profit is achieved using the last setting of the exit conditions. Note that for this to work, you must have a Fixed SL set-up.
➕ OTHER EXIT FEATURES
1. Move Stop Loss to Breakeven
This setting allows the strategy to automatically move the SL to Breakeven (BE) when the position is in profit by a certain amount. Users can choose between the following:
Price: This method moves the SL to BE when price reaches a specified level.
Ticks: This method moves the SL to BE when price moves a specified number of ticks.
Percentage (%): This method moves the SL to BE when price moves a specified percentage.
ATR: This method moves the SL to BE when price moves a specified multiple of the Average True Range (ATR).
Example Entry Scenario
To give an example , check this scenario; out conditions are :
LONG CONDITIONS
Demand Zone Detection, Step 1
Supply Zone Retest, Step 2
Demand Zone Break, Step 2
open > close, Step 3
First, the strategy needs to detect a Demand Zone Detection in order to start working.
After it's detected, now it's looking for either a Supply Zone Retest, or a Demand Zone Break to proceed to the next step, the reason for this is that they both have the same step number.
After one of them is detected, the strategy will consistently check candlesticks for the condition open > close. If a bullish candlestick occurs, a long position will be entered.
⏰ ALERTS
This indicator uses TradingView's strategy alert system. All entries and exits will be sent as an alert if configured. It's possible to further customize these alerts to your liking. For more information check TradingView's strategy alert customization page : www.tradingview.com
⚙️ SETTINGS
1. Backtesting Settings
Pyramiding: Controls the number of simultaneous trades allowed in the strategy. This setting must have the same value that is entered on the script's properties tab on the settings pane.
Enable Custom Backtesting Period: Restricts backtesting to a specific date range.
Start & End Time Configuration: Define precise start and end dates for historical analysis.
2. General Configuration
Detection Method: There are two detection methods you can choose from for identifying Supply & Demand Zones. Both methods aim to identify key areas where price is likely to react, but they do so using different approaches. Traders can choose the method that aligns with their trading style and time horizon.
Sensitivity: The Sensitivity setting allows traders to adjust how aggressively the script identifies supply and demand zones when using the Momentum Detection Method. This setting directly impacts the threshold for detecting zones when using the momentum detection method.
Zone Invalidation: The Zone Invalidation setting determines how supply and demand zones are invalidated.
Wick -> A zone is invalidated if a candle’s wick goes below a demand zone or above a supply zone.
Close -> A zone is invalidated if a candle closes below a demand zone or above a supply zone.
Zone Visibility Range: The Zone Visibility Range setting controls how far from the current price supply and demand zones are displayed on the chart. It helps traders focus on relevant zones while avoiding clutter from distant or less impactful areas.
Minimum Zone Width: The Minimum Zone Width setting defines the smallest size a supply or demand zone must have to be displayed on the chart. It uses the Average True Range (ATR) as a reference to ensure zones are proportionate to current market volatility.
Minimum Zone Length: The Minimum Zone Length setting determines the minimum number of bars a supply or demand zone must span to be displayed on the chart. This setting helps filter out short-lived or insignificant zones, ensuring only meaningful areas of supply or demand are highlighted.
3. Multi-Timeframe Analysis
Enable Up to Three Timeframes: Select and analyze trades across multiple timeframes.
4. Entry Conditions for Long & Short Trades
Multiple Conditions (1-6): Configure up to six independent conditions per trade direction.
Condition Types: Options include Detection, Retest, 2nd Retest, 3rd Retest, Retracement, and Break.
Timeframe Specification: Choose between "Any Timeframe", "Timeframe 1", "Timeframe 2", or "Timeframe 3".
Trade Execution Filters: Restrict trades within specific trading sessions.
5. Exit Conditions for Long & Short Trades
Exit on Opposite Signal: Automatically exit trades upon opposite trade conditions.
Exit on Session End: Closes all positions at the end of the trading session.
Multiple Take-Profit (TP) and Stop-Loss (SL) Configurations:
TP/SL based on % move, ATR, Ticks, or Fixed Price.
Hard SL option for additional risk control.
Move SL to BE (Break Even) after a certain profit threshold.

Flux Charts - PAT Automation💎 GENERAL OVERVIEW
The PAT Automation is a powerful and versatile tool designed to help traders rigorously test their trading strategies against historical market data. With an array of advanced settings, traders can fine-tune their strategies, assess performance, and identify key improvements before deploying in live trading environments. This backtester offers a wide range of configurable settings, explained within this write-up.
Features of the PAT Automation:
Step By Step : Configure your strategy step by step, which will allow you to have OR & AND logic in your strategies.
Highly Configurable : Offers multiple parameters for fine-tuning trade entry and exit conditions.
Multi-Timeframe Analysis : Allows traders to analyze multiple timeframes simultaneously for enhanced accuracy.
Provides advanced stop-loss, take-profit, and break-even settings.
Incorporates volume-based conditions, liquidity grabs , order blocks , market structures and fair value gaps for refined strategy execution.
🚩 UNIQUENESS
The PAT Automation stands out from conventional backtesting tools due to its unparalleled flexibility, precision, and advanced trading logic integration. Key factors that make it unique include:
✅ Comprehensive Strategy Customization – Unlike traditional backtesters that offer basic entry and exit conditions, PAT Automation provides a highly detailed parameter set, allowing traders to fine-tune their strategies with precision.
✅ Multi-Timeframe Price Action Features – This is the first-ever tool that allows traders to backtest price action with multi-timeframe features such as Fair Value Gaps (FVGs), Inversion Fair Value Gaps (IFVGs), Order Blocks & Breaker Blocks.
✅ Customizable Take-Profit Conditions – Offers various methods to set take-profit exits, including using core features from price action, and fixed exits like ATR, % change or price change, enabling traders to tailor their exit strategies to specific market behaviors.
✅ Customizable Stop-Loss Conditions – Provides several ways to set up stop losses, including using concepts from price action and trailing stops or fixed exits like ATR, % change or price change, allowing for dynamic risk management tailored to individual strategies.
✅ Integration of External Indicators – Allows the inclusion of other indicators or data sources from TradingView for creating strategy conditions, enabling traders to enhance their strategies with additional insights and data points.
By integrating these advanced features, PAT Automation ensures that traders can rigorously test and optimize their strategies with great accuracy and efficiency.
📌 HOW DOES IT WORK?
The first setting you will want to set it the pyramiding setting. This setting controls the number of simultaneous trades in the same direction allowed in the strategy. For example, if you set it to 1, only one trade can be active in any time, and the second trade will not be entered unless the first one is exited. If it is set to 2, the script will handle both of them at the same time. Note that you should enter the same value to this pyramiding setting, and the pyramiding setting in the "Properties" tab of the script for this to work.
For deep backtesting, you can set "Max Distance To Last Bar" to "Unlimited". If you encounter any memory issues, try decreasing this setting to a lower value.
You can enable and set a backtesting window that will limit the entries to between the start date & end date.
Then, you can enter your desired settings to Price Action features like FVGs, IFVGs, Order Blocks, Breaker Blocks, Liquidity Grabs, Market Structures, EQH & EQL and Volume Imbalances. You can also enable and set up to 3 timeframes, which you can use later on when customizing your strategies enter / exit conditions.
Entry Conditions
From the "Long Conditions" or the "Short Conditions" groups, you can set your position entry conditions. For settings like "initial capital" or "order size", you can open the "Properties" tab, where these are handled.
The PAT Automation can use the following conditions for entry conditions :
1. Order Block (OB)
Detection: Triggered when an Order Block forms or is detected
Retest: Triggered when price retests an Order Block. A retest is confirmed when a candle enters an Order Block and closes outside of it.
Retracement: Triggered when price touches an Order Block
Break: Triggered when an Order Block is invalidated by candle close or wick, depending on the user's input.
2. Breaker Block (BB)
Detection: Triggered when a Breaker Block forms or is detected
Retest: Triggered when price retests a Breaker Block. A retest is confirmed when a candle enters a Breaker Block and closes outside of it.
Retracement: Triggered when price touches a Breaker Block
Break: Triggered when a Breaker Block is invalidated by candle close or wick, depending on the user's input.
3. Fair Value Gap (FVG)
Detection: Triggered when an FVG forms or is detected
Retest: Triggered when price retests an FVG. A retest is confirmed when a candle enters an FVG and closes outside of it.
Retracement: Triggered when price touches an FVG
Break: Triggered when an FVG is invalidated by candle close or wick, depending on the user's input.
4. Inversion Fair Value Gap (IFVG)
Detection: Triggered when an IFVG forms or is detected
Retest: Triggered when price retests an IFVG. A retest is confirmed when a candle enters an IFVG and closes outside of it.
Retracement: Triggered when price touches an IFVG
Break: Triggered when an IFVG is invalidated by candle close or wick, depending on the user's input.
5. Break of Structure (BOS)
Detection: Triggered when a BOS forms or is detected
6. Change of Character (CHoCH)
Detection: Triggered when a CHoCH forms or is detected
7. Change of Character Plus (CHoCH+)
Detection: Triggered when a CHoCH+ forms or is detected
8. Volume Imbalance (VI)
Detection: Triggered when a Volume Imbalance forms or is detected
9. Equal High (EQH)
Detection: Triggered when an EQH is detected
10. Equal Low (EQL)
Detection: Triggered when an EQL is detected
11. Buyside Liquidity Grab
Detection: Triggered when a liquidity grab occurs at Buyside Liquidity (BSL).
12. Sellside Liquidity Grab
Detection: Triggered when a liquidity grab occurs at Sellside Liquidity (SSL).
🕒 TIMEFRAME CONDITIONS
The PAT Automation supports Multi-Timeframe (MTF) features, just like the Price Action Toolkit. When setting an entry condition, you can also choose the timeframe.
To set up MTF conditions, navigate to the 'Timeframes' section in the settings, select your desired timeframes, and enable them. You can choose up to three timeframes.
Once you've selected your timeframes, you can use them in your strategy. When setting long and short entry / exit conditions, you can choose from Timeframe 1, Timeframe 2, or Timeframe 3.
External Conditions
Users can use external indicators on the chart to set entry conditions.
The second dropdown in the external condition settings allows you to choose a conditional operator to compare external outputs. Available options include:
Less Than or Equal To: <=
Less Than: <
Equal To: =
Greater Than: >
Greater Than or Equal To: >=
The position entry conditions work like this ;
Each side has 5 Price Action conditions and 1 Source condition. Each condition can be enabled or disabled using the checkbox on the left side.
For Price Action Conditions, you can set a direction: "Any", "Bullish" or "Bearish".
Then a Price Action Feature, like "FVG" or "Order Block".
The last part of our constructed condition is the alert type, which you can select between "Detection", "Retest", "Retracement" or "Break".
Now you should have a constructed condition, which should look like "Bullish Order Block Retest".
You can select which timeframe should this condition work on from Timeframe 1, 2 or 3. If you select "Any Timeframe", the condition will work for all timeframes.
Lastly select the step of this condition from 1 to 6.
The Source Condition
The last condition on each side is a source condition that is different from the others. Using this condition, you can create your own logic using other indicators' outputs on your chart. For example, suppose that you have an EMA indicator in your chart. You can have the source condition to something like "EMA > high".
The Step System
Each condition has a step number, and conditions are in topological order based on them.
The conditions are executed step by step. This means the condition with step 2 cannot be executed before the condition with step 1 is executed.
Conditions with the same step numbers have "OR" logic. This means that if you have 2 conditions with step 3, the condition with step 4 can trigger after only one of the step 3 conditions is executed.
➕ OTHER ENTRY FEATURES
The PAT Automation allows traders to choose when to execute trades and when not to execute trades.
1. Only Take Trades
This setting lets users specify the time period when their strategy can open or execute trades.
2. Don't Take Trades
This setting lets users specify time periods when their strategy can't open or execute trades.
↩️ EXIT CONDITIONS
1. Exit on Opposite Signal
When enabled, a long position will close when short entry conditions are met, and a short position will close when long entry conditions are met.
2. Exit on Session End
When enabled, positions will be closed at the end of the trading session.
📈 TAKE PROFIT CONDITIONS
There are several methods available for setting take profit exits and conditions.
1. Entry Condition TP
Users can use entry conditions as triggers for take-profit exits. This setting can be found under the long and short exit conditions.
2. Fixed TP
Users can set a fixed TP for exits. This setting can be found under the long and short exit conditions. Users can choose between the following:
Price: This method triggers a TP exit when price reaches a specified level. For example, if you set the Price TP to 10 and buy NASDAQ:TSLA at $190, the trade will automatically exit when the price reaches $200 ($190 + $10).
Ticks: This method triggers a TP exit when price moves a specified number of ticks.
Percentage (%): This method triggers a TP exit when price moves a specified percentage.
ATR: This method triggers a TP exit based on a specified multiple of the Average True Range (ATR).
📉 STOP LOSS CONDITIONS
There are several methods available for setting stop-loss exits and conditions.
1. Entry Condition SL
Users can use entry conditions as triggers for stop-loss exits. This setting can be found under the long and short exit conditions.
2. Fixed SL
Users can set a fixed SL for exits. This setting can be found under the long and short exit conditions. Users can choose between the following:
Price: This method triggers a SL exit when price reaches a specified level. For example, if you set the Price SL to 10 and buy NASDAQ:TSLA at $200, the trade will automatically exit when the price reaches $190 ($200 - $10).
Ticks: This method triggers a SL exit when price moves a specified number of ticks.
Percentage (%): This method triggers a SL exit when price moves a specified percentage.
ATR: This method triggers a SL exit based on a specified multiple of the Average True Range (ATR).
3. Trailing Stop
An explanation & example for the trailing stop feature is present on the write-up within the next section.
Exit conditions have the same logic of constructing conditions like the entry ones. You can construct a Take-Profit Condition & a Stop-Loss Condition. Note that the Take-Profit condition will only work if the position is in profit, regardless of if it's triggered or not. The same applies for the Stop-Loss condition, meaning that it will only work if the position is in loss.
You can also set a Fixed TP & Fixed SL based on the price movement after the position is entered. You have options like "Price", "Ticks", "%", or "Average True Range". For example, you can set a Fixed TP like "5%", and the position will be entered once it moves 5% up in a long position.
Trailing Stop
For the Fixed SL, you also have a "Trailing" stop option, which you can set it's activation level as well. The Trailing stop activation level and it's value are expressed in ticks. Check this scenerio for an example :
We have a ticker with a tick value of $1. Our Trailing Stop is set to 10 ticks and activation level is set to 30 ticks.
We buy 1 contract when the price is $100.
When the price becomes $110, we are in $10 (10 ticks) profit and the trailing stop is now activated.
The current price our stop's on is $110 - $30 (30 ticks), which is the level of $80.
The trailing stop will only move if the price moves up the highest high the price has been after we entered the position.
Let's suppose that price moves up $40 right after our trailing stop is activated. The price will now be $150, and our trailing stop will sit on $150 - $30 (30 ticks) = $120.
If the price is down the $120 level, our stop loss will be triggered.
There is also a "Hard SL" option designed for a backup stop-loss when trailing stops are enabled. You can enable & set this option and if the price goes down before our trailing stop even activates, the position will be exited.
You can also move stop-loss to the break-even (entry price of the position) after a certain profit is achieved using the last setting of the exit conditions. Note that for this to work, you will need to have a Fixed SL set-up.
➕ OTHER EXIT FEATURES
1. Move Stop Loss to Breakeven
This setting allows the strategy to automatically move the SL to Breakeven (BE) when the position is in profit by a certain amount. Users can choose between the following:
Price: This method moves the SL to BE when price reaches a specified level.
Ticks: This method moves the SL to BE when price moves a specified number of ticks.
Percentage (%): This method moves the SL to BE when price moves a specified percentage.
ATR: This method moves the SL to BE when price moves a specified multiple of the Average True Range (ATR).
Example Entry Scenario
To give an example , check this scenario; out conditions are :
LONG CONDITIONS
Bullish Order Block Detection, Step 1
Bullish CHoCH Detection, Step 2
Bullish Volume Imbalance Detection, Step 2
Bullish IFVG Retest, Step 3
First, the strategy needs to detect a Bullish Order Block in order to start working.
After it's detected, now it's looking for either a CHoCH, or a Volume Imbalance to proceed to the next step, the reason for this is that they both have the same step number.
After one of them is detected, the strategy will consistently check all IFVGs for a retest. If the retest occurs, a long position will be entered.
⏰ ALERTS
This indicator uses TradingView's strategy alert system. All entries and exits will be sent as an alert if configured. It's possible to further customize these alerts to your liking. For more information check TradingView's strategy alert customization page: www.tradingview.com
⚙️ SETTINGS
1. Backtesting Settings
Pyramiding: Controls the number of simultaneous trades allowed in the strategy. This setting must have the same value that is entered on the script's properties tab on the settings pane.
Max Distance to Last Bar: Determines the depth of historical data used to prevent memory overload.
Enable Custom Backtesting Period: Restricts backtesting to a specific date range.
Start & End Time Configuration: Define precise start and end dates for historical analysis.
2. Fair Value Gaps Settings
Zone Invalidation: Select between "Wick" and "Close" invalidation.
Filtering: Choose between "Average Range" and "Volume Threshold".
FVG Sensitivity: Ranges from Extreme to Low to detect FVGs with varying strictness.
Allow Gaps: Enables analysis on tickers that have different open-close price gaps.
3. Inversion Fair Value Gaps Settings
Zone Invalidation: Choose between "Wick" and "Close".
4. Order Block Settings
Swing Length: Adjusts the minimum number of bars required for OB formation.
Zone Invalidation Method: Select between "Wick" and "Close".
5. Breaker Block Settings
Zone Invalidation: Set invalidation method as "Wick" or "Close".
6. Liquidity Grabs Settings
Pivot Length: Adjusts the number of bars used to detect liquidity grabs.
Wick-Body Ratio: Defines the proportion of wick-to-body size for liquidity grab detection.
7. Multi-Timeframe Analysis
Enable Up to Three Timeframes: Select and analyze trades across multiple timeframes.
8. Market Structures
Swing Length: Defines the number of bars required for structure shifts.
Includes BOS, CHoCH, CHoCH+ Detection.
9. Equal Highs & Lows
ATR Multiplier: Defines the sensitivity of equal highs/lows detection.
10. Volume Imbalances
Gap Size Sensitivity: Ranges from "Ultra" to "Low".
Disable Overnight Gaps: Filters out volume imbalances occurring due to overnight gaps.
11. Entry Conditions for Long & Short Trades
Multiple Conditions (1-6): Configure up to six independent conditions per trade direction.
Condition Types: Options include Detection, Retest, Retracement, and Break.
Timeframe Specification: Choose between "Any Timeframe", "Timeframe 1", "Timeframe 2", or "Timeframe 3".
Trade Execution Filters: Restrict trades within specific trading sessions.
12. Exit Conditions for Long & Short Trades
Exit on Opposite Signal: Automatically exit trades upon opposite trade conditions.
Exit on Session End: Closes all positions at the end of the trading session.
Multiple Take-Profit (TP) and Stop-Loss (SL) Configurations:
TP/SL based on % move, ATR, Ticks, or Fixed Price.
Hard SL option for additional risk control.
Move SL to BE (Break Even) after a certain profit threshold.
